Trendline Breaks with Multi Fibonacci Supertrend StrategyTMFS Strategy: Advanced Trendline Breakouts with Multi-Fibonacci Supertrend
Elevate your algorithmic trading with institutional-grade signal confluence
Strategy Genesis & Evolution
This advanced trading system represents the culmination of a personal research journey, evolving from my custom " Multi Fibonacci Supertrend with Signals " indicator into a comprehensive trading strategy. Built upon the exceptional trendline detection methodology pioneered by LuxAlgo in their " Trendlines with Breaks " indicator, I've engineered a systematic framework that integrates multiple technical factors into a cohesive trading system.
Core Fibonacci Principles
At the heart of this strategy lies the Fibonacci sequence application to volatility measurement:
// Fibonacci-based factors for multiple Supertrend calculations
factor1 = input.float(0.618, 'Factor 1 (Weak/Fibonacci)', minval = 0.01, step = 0.01)
factor2 = input.float(1.618, 'Factor 2 (Medium/Golden Ratio)', minval = 0.01, step = 0.01)
factor3 = input.float(2.618, 'Factor 3 (Strong/Extended Fib)', minval = 0.01, step = 0.01)
These precise Fibonacci ratios create a dynamic volatility envelope that adapts to changing market conditions while maintaining mathematical harmony with natural price movements.
Dynamic Trendline Detection
The strategy incorporates LuxAlgo's pioneering approach to trendline detection:
// Pivotal swing detection (inspired by LuxAlgo)
pivot_high = ta.pivothigh(swing_length, swing_length)
pivot_low = ta.pivotlow(swing_length, swing_length)
// Dynamic slope calculation using ATR
slope = atr_value / swing_length * atr_multiplier
// Update trendlines based on pivot detection
if bool(pivot_high)
upper_slope := slope
upper_trendline := pivot_high
else
upper_trendline := nz(upper_trendline) - nz(upper_slope)
This adaptive trendline approach automatically identifies key structural market boundaries, adjusting in real-time to evolving chart patterns.
Breakout State Management
The strategy implements sophisticated state tracking for breakout detection:
// Track breakouts with state variables
var int upper_breakout_state = 0
var int lower_breakout_state = 0
// Update breakout state when price crosses trendlines
upper_breakout_state := bool(pivot_high) ? 0 : close > upper_trendline ? 1 : upper_breakout_state
lower_breakout_state := bool(pivot_low) ? 0 : close < lower_trendline ? 1 : lower_breakout_state
// Detect new breakouts (state transitions)
bool new_upper_breakout = upper_breakout_state > upper_breakout_state
bool new_lower_breakout = lower_breakout_state > lower_breakout_state
This state-based approach enables precise identification of the exact moment when price breaks through a significant trendline.
Multi-Factor Signal Confluence
Entry signals require confirmation from multiple technical factors:
// Define entry conditions with multi-factor confluence
long_entry_condition = enable_long_positions and
upper_breakout_state > upper_breakout_state and // New trendline breakout
di_plus > di_minus and // Bullish DMI confirmation
close > smoothed_trend // Price above Supertrend envelope
// Execute trades only with full confirmation
if long_entry_condition
strategy.entry('L', strategy.long, comment = "LONG")
This strict requirement for confluence significantly reduces false signals and improves the quality of trade entries.
Advanced Risk Management
The strategy includes sophisticated risk controls with multiple methodologies:
// Calculate stop loss based on selected method
get_long_stop_loss_price(base_price) =>
switch stop_loss_method
'PERC' => base_price * (1 - long_stop_loss_percent)
'ATR' => base_price - long_stop_loss_atr_multiplier * entry_atr
'RR' => base_price - (get_long_take_profit_price() - base_price) / long_risk_reward_ratio
=> na
// Implement trailing functionality
strategy.exit(
id = 'Long Take Profit / Stop Loss',
from_entry = 'L',
qty_percent = take_profit_quantity_percent,
limit = trailing_take_profit_enabled ? na : long_take_profit_price,
stop = long_stop_loss_price,
trail_price = trailing_take_profit_enabled ? long_take_profit_price : na,
trail_offset = trailing_take_profit_enabled ? long_trailing_tp_step_ticks : na,
comment = "TP/SL Triggered"
)
This flexible approach adapts to varying market conditions while providing comprehensive downside protection.
Performance Characteristics
Rigorous backtesting demonstrates exceptional capital appreciation potential with impressive risk-adjusted metrics:
Remarkable total return profile (1,517%+)
Strong Sortino ratio (3.691) indicating superior downside risk control
Profit factor of 1.924 across all trades (2.153 for long positions)
Win rate exceeding 35% with balanced distribution across varied market conditions
Institutional Considerations
The strategy architecture addresses execution complexities faced by institutional participants with temporal filtering and date-range capabilities:
// Time Filter settings with flexible timezone support
import jason5480/time_filters/5 as time_filter
src_timezone = input.string(defval = 'Exchange', title = 'Source Timezone')
dst_timezone = input.string(defval = 'Exchange', title = 'Destination Timezone')
// Date range filtering for precise execution windows
use_from_date = input.bool(defval = true, title = 'Enable Start Date')
from_date = input.time(defval = timestamp('01 Jan 2022 00:00'), title = 'Start Date')
// Validate trading permission based on temporal constraints
date_filter_approved = time_filter.is_in_date_range(
use_from_date, from_date, use_to_date, to_date, src_timezone, dst_timezone
)
These capabilities enable precise execution timing and market session optimization critical for larger market participants.
Acknowledgments
Special thanks to LuxAlgo for the pioneering work on trendline detection and breakout identification that inspired elements of this strategy. Their innovative approach to technical analysis provided a valuable foundation upon which I could build my Fibonacci-based methodology.
This strategy is shared under the same Attribution-NonCommercial-ShareAlike 4.0 International (CC BY-NC-SA 4.0) license as LuxAlgo's original work.
Past performance is not indicative of future results. Conduct thorough analysis before implementing any algorithmic strategy.
Search in scripts for "profit factor"

Slight Swing Momentum Strategy.Introduction:
The Swing Momentum Strategy is a quantitative trading strategy designed to capture mid-term opportunities in the financial markets by combining swing trading principles with momentum indicators. It utilizes a combination of technical indicators, including moving averages, crossover signals, and volume analysis, to generate buy and sell signals. The strategy aims to identify market trends and capitalize on price momentum for profit generation.
Highlights:
The strategy offers several key highlights that make it unique and potentially attractive to traders:
Swing Trading with Momentum: The strategy combines the principles of swing trading, which aim to capture short-to-medium-term price swings, with momentum indicators that help identify strong price trends and potential breakout opportunities.
Technical Indicator Optimization: The strategy utilizes a selection of optimized technical indicators, including moving averages and crossover signals, to filter out the noise and focus on high-probability trading setups. This optimization enhances the strategy's ability to identify favourable entry and exit points.
Risk Management: The strategy incorporates risk management techniques, such as position sizing based on equity and dynamic stop loss levels, to manage risk exposure and protect capital. This helps to minimize drawdowns and preserve profits.
Buy Condition:
The buy condition in the strategy is determined by a combination of factors, including A1, A2, A3, XG, and weeklySlope. Let's break it down:
A1 Condition: The A1 condition checks for specific price relationships. It verifies that the ratio of the highest price to the closing price is less than 1.03, the ratio of the opening price to the lowest price is less than 1.03, and the ratio of the highest price to the previous day's closing price is greater than 1.06. This condition looks for a specific pattern indicating potential bullish momentum.
A2 Condition: The A2 condition checks for price relationships related to the closing price. It verifies that the ratio of the closing price to the opening price is greater than 1.05 or that the ratio of the closing price to the previous day's closing price is greater than 1.05. This condition looks for signs of upward price movement and momentum.
A3 Condition: The A3 condition focuses on volume. It checks if the current volume crosses above the highest volume over the last 60 periods. This condition aims to identify increased buying interest and potentially confirms the strength of the potential upward price movement.
XG Condition: The XG condition combines the A1 and A2 conditions and checks if they are true for both the current and previous bars. It also verifies that the ratio of the closing price to the 5-period EMA crosses above the 9-period SMA of the same ratio. This condition helps identify potential buy signals when multiple factors align, indicating a strong bullish momentum and potential entry point.
Weekly Trend Factor: The weekly slope condition calculates the slope of the 50-period SMA over a weekly timeframe. It checks if the slope is positive, indicating an overall upward trend on a weekly basis. This condition provides additional confirmation that the stock is in an upward trend.
When all of these conditions align, the buy condition is triggered, indicating a favourable time to enter a long position.
Sell Condition:
The sell condition is relatively straightforward in the strategy:
Sell Signal: The sell condition simply checks if the closing price crosses below the 10-period EMA. When this condition is met, it indicates a potential reversal or weakening of the upward price momentum, and a sell signal is generated.
Backtest Outcome:
The strategy was backtested over the period from January 22nd, 1999 to May 3rd, 2023, using daily candlestick charts for the NASDAQ: NVDA. The strategy used an initial capital of 1,000,000 USD, The order quantity is defined as 10% of the equity. The strategy allows for pyramiding with 1 order, and the transaction fee is set at 0.03% per trade. Here are the key outcomes of the backtest:
Net Profit: 539,595.84 USD, representing a return of 53.96%.
Percent Profitable: 48.82%
Total Closed Trades: 127
Profit Factor: 2.331
Max Drawdown: 68,422.70 USD
Average Trade: 4,248.79 USD
Average Number of Bars in Trades: 11, indicating the average duration of the trades.
Conclusion:
In conclusion, the Swing Momentum Strategy is a quantitative trading approach that combines swing trading principles with momentum indicators to identify and capture mid term trading opportunities. The strategy has demonstrated promising results during backtesting, including a significant net profit and a favourable profit factor.

Multi Fibonacci Supertrend with Signals【FIbonacciFlux】Multi Fibonacci Supertrend with Signals (MFSS)
Overview
The Multi Fibonacci Supertrend with Signals (MFSS) is an advanced technical analysis tool that combines multiple Supertrend indicators using Fibonacci ratios to identify trend directions and potential trading opportunities.
Key Features
1. Fibonacci-Based Supertrend Levels
* Factor 1 (Weak) : 0.618 - The golden ratio
* Factor 2 (Medium) : 1.618 - The Fibonacci ratio
* Factor 3 (Strong) : 2.618 - The extension ratio
2. Visual Components
* Multi-layered Trend Lines
* Different line weights for easy identification
* Progressive transparency from Factor 1 to Factor 3
* Color-coded trend directions (Green for bullish, Red for bearish)
* Dynamic Fill Areas
* Gradient fills between price and trend lines
* Visual representation of trend strength
* Automatic color adjustment based on trend direction
* Signal Indicators
* Clear BUY/SELL labels on chart
* Position-adaptive signal placement
* High-visibility color scheme
3. Signal Generation Logic
The system generates signals based on two key conditions:
* Primary Condition :
* BUY : Price crossunder Supertrend2 (Factor 1.618)
* SELL : Price crossover Supertrend2 (Factor 1.618)
* Confirmation Filter :
* Signals only trigger when Supertrend3 confirms the trend direction
* Reduces false signals in volatile markets
Technical Details
Input Parameters
* ATR Period : 10 (default)
* Customizable for different market conditions
* Affects sensitivity of all Supertrend levels
* Factor Settings :
* All factors are customizable
* Default values based on Fibonacci sequence
* Minimum value: 0.01
* Step size: 0.01
Alert System
* Built-in alert conditions
* Customizable alert messages
* Real-time notification support
Use Cases
* Trend Trading
* Identify strong trend directions
* Filter out weak signals
* Confirm trend continuations
* Risk Management
* Multiple trend levels for stop-loss placement
* Clear entry and exit signals
* Trend strength visualization
* Market Analysis
* Multi-timeframe analysis capability
* Trend strength assessment
* Market structure identification
Benefits
* Reliability
* Based on proven Supertrend algorithm
* Enhanced with Fibonacci mathematics
* Multiple confirmation levels
* Clarity
* Clear visual signals
* Easy-to-interpret interface
* Reduced noise in signal generation
* Flexibility
* Customizable parameters
* Adaptable to different markets
* Suitable for various trading styles
Performance Considerations
* Optimized code structure
* Efficient calculation methods
* Minimal resource usage
Installation and Usage
Setup
* Add indicator to chart
* Adjust parameters if needed
* Enable alerts as required
Best Practices
* Use with other confirmation tools
* Adjust factors based on market volatility
* Consider timeframe appropriateness
Backtesting Results and Strategy Performance
This indicator is specifically designed for pullback trading with optimized risk-reward ratios in trend-following strategies. Below are the detailed backtesting results from our proprietary strategy implementation:
BTCUSDT Performance (Binance)
* Test Period: Approximately 7 years
* Risk-Reward Ratio: 2:1
* Take Profit: 8%
* Stop Loss: 4%
Key Metrics (BTCUSDT):
* Net Profit: +2,579%
* Total Trades: 551
* Win Rate: 44.8%
* Profit Factor: 1.278
* Maximum Drawdown: 42.86%
ETHUSD Performance (Binance)
* Risk-Reward Ratio: 4.33:1
* Take Profit: 13%
* Stop Loss: 3%
Key Metrics (ETHUSD):
* Net Profit: +8,563%
* Total Trades: 581
* Win Rate: 32%
* Profit Factor: 1.32
* Maximum Drawdown: 55%
Strategy Highlights:
* Optimized for pullback trading in strong trends
* Focus on high risk-reward ratios
* Proven effectiveness in major cryptocurrency pairs
* Consistent performance across different market conditions
* Robust profit factor despite moderate win rates
Note: These results are from our proprietary strategy implementation and should be used as reference only. Individual results may vary based on market conditions and implementation.
Important Considerations:
* The strategy demonstrates strong profitability despite lower win rates, emphasizing the importance of proper risk-reward ratios
* Higher drawdowns are compensated by significant overall returns
* The system shows adaptability across different cryptocurrencies with consistent profit factors
* Results suggest optimal performance in volatile crypto markets
Real Trading Examples
BTCUSDT 4-Hour Chart Analysis
Example of pullback strategy implementation on Bitcoin, showing clear trend definition and entry points
ETHUSDT 4-Hour Chart Analysis
Ethereum chart demonstrating effective signal generation during strong trends
BTCUSDT Detailed Signal Example (15-Minute Scalping)
Close-up view of signal generation and trend confirmation process on 15-minute timeframe, demonstrating the indicator's effectiveness for scalping operations
Chart Analysis Notes:
* Green and red zones clearly indicate trend direction
* Multiple timeframe confirmation visible through different Supertrend levels
* Clear entry signals during pullbacks in established trends
* Precise stop-loss placement opportunities below support levels
Implementation Guidelines:
* Wait for main trend confirmation from Factor 3 (2.618)
* Enter trades on pullbacks to Factor 2 (1.618)
* Use Factor 1 (0.618) for fine-tuning entry points
* Place stops below the relevant Supertrend level
Footnotes:
* Charts provided are from Binance exchange, using both 4-hour and 15-minute timeframes
* Trading view screenshots captured during actual market conditions
* Indicators shown: Multi Fibonacci Supertrend with all three factors
* Time period: Recent market activity showing various market conditions
Important Notice:
These charts are for educational purposes only. Past performance does not guarantee future results. Always conduct your own analysis and risk management.
Disclaimer
This indicator is for informational purposes only. Past performance is not indicative of future results. Always conduct proper risk management and due diligence.
License
Open source under MIT License
Author's Note
Contributions and suggestions for improvement are welcome. Please feel free to fork and enhance.

Golden Cross 50/200 EMATrend-following systems are characterized by having a low win rate, yet in the right circumstances (trending markets and higher timeframes) they can deliver returns that even surpass those of systems with a high win rate.
Below, I show you a simple bullish trend-following system with clear execution rules:
System Rules
-Long entries when the 50-period EMA crosses above the 200-period EMA.
-Stop Loss (SL) placed at the lowest low of the 15 candles prior to the entry candle.
-Take Profit (TP) triggered when the 50-period EMA crosses below the 200-period EMA.
Risk Management
-Initial capital: $10,000
-Position size: 10% of capital per trade
-Commissions: 0.1% per trade
Important Note:
In the code, the stop loss is defined using the swing low (15 candles), but the position size is not adjusted based on the distance to the stop loss. In other words, 10% of the equity is risked on each trade, but the actual loss on the trade is not controlled by a maximum fixed percentage of the account — it depends entirely on the stop loss level. This means the loss on a single trade could be significantly higher or lower than 10% of the account equity, depending on volatility.
Implementing leverage or reducing position size based on volatility is something I haven’t been able to include in the code, but it would dramatically improve the system’s performance. It would fix a consistent percentage loss per trade, preventing losses from fluctuating wildly with changes in volatility.
For example, we can maintain a fixed loss percentage when volatility is low by using the following formula:
Leverage = % of SL you’re willing to risk / % volatility from entry point to stop loss
And when volatility is high and would exceed the fixed percentage we want to expose per trade (if the SL is hit), we could reduce the position size accordingly.
Practical example:
Imagine we only want to risk 15% of the position value if the stop loss is triggered on Tesla (which has high volatility), but the distance to the SL represents a potential 23.57% drop. In this case, we subtract the desired risk (15%) from the actual volatility-based loss (23.57%):
23.57% − 15% = 8.57%
Now suppose we normally use $200 per trade.
To calculate 8.57% of $200:
200 × (8.57 / 100) = $17.14
Then subtract that amount from the original position size:
$200 − $17.14 = $182.86
In summary:
If we reduce the position size to $182.86 (instead of the usual $200), even if Tesla moves 23.57% against us and hits the stop loss, we would still only lose approximately 15% of the original $200 position — exactly the risk level we defined. This way, we strictly respect our risk management rules regardless of volatility swings.
I hope this clearly explains the importance of capping losses at a fixed percentage per trade. This keeps risk under control while maintaining a consistent percentage of capital invested per trade — preventing both statistical distortion of the system and the potential destruction of the account.
About the code:
Strategy declaration:
The strategy is named 'Golden Cross 50/200 EMA'.
overlay=true means it will be drawn directly on the price chart.
initial_capital=10000 sets the initial capital to $10,000.
default_qty_type=strategy.percent_of_equity and default_qty_value=10 means each trade uses 10% of available equity.
margin_long=0 indicates no margin is used for long positions (this is likely for simulation purposes only; in real trading, margin would be required).
commission_type=strategy.commission.percent and commission_value=0.1 sets a 0.1% commission per trade.
Indicators:
Calculates two EMAs: a 50-period EMA (ema50) and a 200-period EMA (ema200).
Crossover detection:
bullCross is triggered when the 50-period EMA crosses above the 200-period EMA (Golden Cross).
bearCross is triggered when the 50-period EMA crosses below the 200-period EMA (Death Cross).
Recent swing:
swingLow calculates the lowest low of the previous 15 periods.
Stop Loss:
entryStopLoss is a variable initialized as na (not available) and is updated to the current swingLow value whenever a bullCross occurs.
Entry and exit conditions:
Entry: When a bullCross occurs, the initial stop loss is set to the current swingLow and a long position is opened.
Exit on opposite signal: When a bearCross occurs, the long position is closed.
Exit on stop loss: If the price falls below entryStopLoss while a position is open, the position is closed.
Visualization:
Both EMAs are plotted (50-period in blue, 200-period in red).
Green triangles are plotted below the bar on a bullCross, and red triangles above the bar on a bearCross.
A horizontal orange line is drawn that shows the stop loss level whenever a position is open.
Alerts:
Alerts are created for:Long entry
Exit on bearish crossover (Death Cross)
Exit triggered by stop loss
Favorable Conditions:
Tesla (45-minute timeframe)
June 29, 2010 – November 17, 2025
Total net profit: $12,458.73 or +124.59%
Maximum drawdown: $1,210.40 or 8.29%
Total trades: 107
Winning trades: 27.10% (29/107)
Profit factor: 3.141
Tesla (1-hour timeframe)
June 29, 2010 – November 17, 2025
Total net profit: $7,681.83 or +76.82%
Maximum drawdown: $993.36 or 7.30%
Total trades: 75
Winning trades: 29.33% (22/75)
Profit factor: 3.157
Netflix (45-minute timeframe)
May 23, 2002 – November 17, 2025
Total net profit: $11,380.73 or +113.81%
Maximum drawdown: $699.45 or 5.98%
Total trades: 134
Winning trades: 36.57% (49/134)
Profit factor: 2.885
Netflix (1-hour timeframe)
May 23, 2002 – November 17, 2025
Total net profit: $11,689.05 or +116.89%
Maximum drawdown: $844.55 or 7.24%
Total trades: 107
Winning trades: 37.38% (40/107)
Profit factor: 2.915
Netflix (2-hour timeframe)
May 23, 2002 – November 17, 2025
Total net profit: $12,807.71 or +128.10%
Maximum drawdown: $866.52 or 6.03%
Total trades: 56
Winning trades: 41.07% (23/56)
Profit factor: 3.891
Meta (45-minute timeframe)
May 18, 2012 – November 17, 2025
Total net profit: $2,370.02 or +23.70%
Maximum drawdown: $365.27 or 3.50%
Total trades: 83
Winning trades: 31.33% (26/83)
Profit factor: 2.419
Apple (45-minute timeframe)
January 3, 2000 – November 17, 2025
Total net profit: $8,232.55 or +80.59%
Maximum drawdown: $581.11 or 3.16%
Total trades: 140
Winning trades: 34.29% (48/140)
Profit factor: 3.009
Apple (1-hour timeframe)
January 3, 2000 – November 17, 2025
Total net profit: $9,685.89 or +94.93%
Maximum drawdown: $374.69 or 2.26%
Total trades: 118
Winning trades: 35.59% (42/118)
Profit factor: 3.463
Apple (2-hour timeframe)
January 3, 2000 – November 17, 2025
Total net profit: $8,001.28 or +77.99%
Maximum drawdown: $755.84 or 7.56%
Total trades: 67
Winning trades: 41.79% (28/67)
Profit factor: 3.825
NVDA (15-minute timeframe)
January 3, 2000 – November 17, 2025
Total net profit: $11,828.56 or +118.29%
Maximum drawdown: $1,275.43 or 8.06%
Total trades: 466
Winning trades: 28.11% (131/466)
Profit factor: 2.033
NVDA (30-minute timeframe)
January 3, 2000 – November 17, 2025
Total net profit: $12,203.21 or +122.03%
Maximum drawdown: $1,661.86 or 10.35%
Total trades: 245
Winning trades: 28.98% (71/245)
Profit factor: 2.291
NVDA (45-minute timeframe)
January 3, 2000 – November 17, 2025
Total net profit: $16,793.48 or +167.93%
Maximum drawdown: $1,458.81 or 8.40%
Total trades: 172
Winning trades: 33.14% (57/172)
Profit factor: 2.927

888 BOT #backtest█ 888 BOT #backtest (open source)
This is an Expert Advisor 'EA' or Automated trading script for ‘longs’ and ‘shorts’, which uses only a Take Profit or, in the worst case, a Stop Loss to close the trade.
It's a much improved version of the previous ‘Repanocha’. It doesn`t use 'Trailing Stop' or 'security()' functions (although using a security function doesn`t mean that the script repaints) and all signals are confirmed, therefore the script doesn`t repaint in alert mode and is accurate in backtest mode.
Apart from the previous indicators, some more and other functions have been added for Stop-Loss, re-entry and leverage.
It uses 8 indicators, (many of you already know what they are, but in case there is someone new), these are the following:
1. Jurik Moving Average
It's a moving average created by Mark Jurik for professionals which eliminates the 'lag' or delay of the signal. It's better than other moving averages like EMA , DEMA , AMA or T3.
There are two ways to decrease noise using JMA . Increasing the 'LENGTH' parameter will cause JMA to move more slowly and therefore reduce noise at the expense of adding 'lag'
The 'JMA LENGTH', 'PHASE' and 'POWER' parameters offer a way to select the optimal balance between 'lag' and over boost.
Green: Bullish , Red: Bearish .
2. Range filter
Created by Donovan Wall, its function is to filter or eliminate noise and to better determine the price trend in the short term.
First, a uniform average price range 'SAMPLING PERIOD' is calculated for the filter base and multiplied by a specific quantity 'RANGE MULTIPLIER'.
The filter is then calculated by adjusting price movements that do not exceed the specified range.
Finally, the target ranges are plotted to show the prices that will trigger the filter movement.
Green: Bullish , Red: Bearish .
3. Average Directional Index ( ADX Classic) and ( ADX Masanakamura)
It's an indicator designed by Welles Wilder to measure the strength and direction of the market trend. The price movement is strong when the ADX has a positive slope and is above a certain minimum level 'ADX THRESHOLD' and for a given period 'ADX LENGTH'.
The green color of the bars indicates that the trend is bullish and that the ADX is above the level established by the threshold.
The red color of the bars indicates that the trend is down and that the ADX is above the threshold level.
The orange color of the bars indicates that the price is not strong and will surely lateralize.
You can choose between the classic option and the one created by a certain 'Masanakamura'. The main difference between the two is that in the first it uses RMA () and in the second SMA () in its calculation.
4. Parabolic SAR
This indicator, also created by Welles Wilder, places points that help define a trend. The Parabolic SAR can follow the price above or below, the peculiarity that it offers is that when the price touches the indicator, it jumps to the other side of the price (if the Parabolic SAR was below the price it jumps up and vice versa) to a distance predetermined by the indicator. At this time the indicator continues to follow the price, reducing the distance with each candle until it is finally touched again by the price and the process starts again. This procedure explains the name of the indicator: the Parabolic SAR follows the price generating a characteristic parabolic shape, when the price touches it, stops and turns ( SAR is the acronym for 'stop and reverse'), giving rise to a new cycle. When the points are below the price, the trend is up, while the points above the price indicate a downward trend.
5. RSI with Volume
This indicator was created by LazyBear from the popular RSI .
The RSI is an oscillator-type indicator used in technical analysis and also created by Welles Wilder that shows the strength of the price by comparing individual movements up or down in successive closing prices.
LazyBear added a volume parameter that makes it more accurate to the market movement.
A good way to use RSI is by considering the 50 'RSI CENTER LINE' centerline. When the oscillator is above, the trend is bullish and when it is below, the trend is bearish .
6. Moving Average Convergence Divergence ( MACD ) and ( MAC-Z )
It was created by Gerald Appel. Subsequently, the histogram was added to anticipate the crossing of MA. Broadly speaking, we can say that the MACD is an oscillator consisting of two moving averages that rotate around the zero line. The MACD line is the difference between a short moving average 'MACD FAST MA LENGTH' and a long moving average 'MACD SLOW MA LENGTH'. It's an indicator that allows us to have a reference on the trend of the asset on which it is operating, thus generating market entry and exit signals.
We can talk about a bull market when the MACD histogram is above the zero line, along with the signal line, while we are talking about a bear market when the MACD histogram is below the zero line.
There is the option of using the MAC-Z indicator created by LazyBear, which according to its author is more effective, by using the parameter VWAP ( volume weighted average price ) 'Z-VWAP LENGTH' together with a standard deviation 'STDEV LENGTH' in its calculation.
7. Volume Condition
Volume indicates the number of participants in this war between bulls and bears, the more volume the more likely the price will move in favor of the trend. A low trading volume indicates a lower number of participants and interest in the instrument in question. Low volumes may reveal weakness behind a price movement.
With this condition, those signals whose volume is less than the volume SMA for a period 'SMA VOLUME LENGTH' multiplied by a factor 'VOLUME FACTOR' are filtered. In addition, it determines the leverage used, the more volume , the more participants, the more probability that the price will move in our favor, that is, we can use more leverage. The leverage in this script is determined by how many times the volume is above the SMA line.
The maximum leverage is 8.
8. Bollinger Bands
This indicator was created by John Bollinger and consists of three bands that are drawn superimposed on the price evolution graph.
The central band is a moving average, normally a simple moving average calculated with 20 periods is used. ('BB LENGTH' Number of periods of the moving average)
The upper band is calculated by adding the value of the simple moving average X times the standard deviation of the moving average. ('BB MULTIPLIER' Number of times the standard deviation of the moving average)
The lower band is calculated by subtracting the simple moving average X times the standard deviation of the moving average.
the band between the upper and lower bands contains, statistically, almost 90% of the possible price variations, which means that any movement of the price outside the bands has special relevance.
In practical terms, Bollinger bands behave as if they were an elastic band so that, if the price touches them, it has a high probability of bouncing.
Sometimes, after the entry order is filled, the price is returned to the opposite side. If price touch the Bollinger band in the same previous conditions, another order is filled in the same direction of the position to improve the average entry price, (% MINIMUM BETTER PRICE ': Minimum price for the re-entry to be executed and that is better than the price of the previous position in a given %) in this way we give the trade a chance that the Take Profit is executed before. The downside is that the position is doubled in size. 'ACTIVATE DIVIDE TP': Divide the size of the TP in half. More probability of the trade closing but less profit.
█ STOP LOSS and RISK MANAGEMENT.
A good risk management is what can make your equity go up or be liquidated.
The % risk is the percentage of our capital that we are willing to lose by operation. This is recommended to be between 1-5%.
% Risk: (% Stop Loss x % Equity per trade x Leverage) / 100
First the strategy is calculated with Stop Loss, then the risk per operation is determined and from there, the amount per operation is calculated and not vice versa.
In this script you can use a normal Stop Loss or one according to the ATR. Also activate the option to trigger it earlier if the risk percentage is reached. '% RISK ALLOWED'
'STOP LOSS CONFIRMED': The Stop Loss is only activated if the closing of the previous bar is in the loss limit condition. It's useful to prevent the SL from triggering when they do a ‘pump’ to sweep Stops and then return the price to the previous state.
█ BACKTEST
The objective of the Backtest is to evaluate the effectiveness of our strategy. A good Backtest is determined by some parameters such as:
- RECOVERY FACTOR: It consists of dividing the 'net profit' by the 'drawdown’. An excellent trading system has a recovery factor of 10 or more; that is, it generates 10 times more net profit than drawdown.
- PROFIT FACTOR: The ‘Profit Factor’ is another popular measure of system performance. It's as simple as dividing what win trades earn by what loser trades lose. If the strategy is profitable then by definition the 'Profit Factor' is going to be greater than 1. Strategies that are not profitable produce profit factors less than one. A good system has a profit factor of 2 or more. The good thing about the ‘Profit Factor’ is that it tells us what we are going to earn for each dollar we lose. A profit factor of 2.5 tells us that for every dollar we lose operating we will earn 2.5.
- SHARPE: (Return system - Return without risk) / Deviation of returns.
When the variations of gains and losses are very high, the deviation is very high and that leads to a very poor ‘Sharpe’ ratio. If the operations are very close to the average (little deviation) the result is a fairly high 'Sharpe' ratio. If a strategy has a 'Sharpe' ratio greater than 1 it is a good strategy. If it has a 'Sharpe' ratio greater than 2, it is excellent. If it has a ‘Sharpe’ ratio less than 1 then we don't know if it is good or bad, we have to look at other parameters.
- MATHEMATICAL EXPECTATION: (% winning trades X average profit) + (% losing trades X average loss).
To earn money with a Trading system, it is not necessary to win all the operations, what is really important is the final result of the operation. A Trading system has to have positive mathematical expectation as is the case with this script: ME = (0.87 x 30.74$) - (0.13 x 56.16$) = (26.74 - 7.30) = 19.44$ > 0
The game of roulette, for example, has negative mathematical expectation for the player, it can have positive winning streaks, but in the long term, if you continue playing you will end up losing, and casinos know this very well.
PARAMETERS
'BACKTEST DAYS': Number of days back of historical data for the calculation of the Backtest.
'ENTRY TYPE': For '% EQUITY' if you have $ 10,000 of capital and select 7.5%, for example, your entry would be $ 750 without leverage. If you select CONTRACTS for the 'BTCUSDT' pair, for example, it would be the amount in 'Bitcoins' and if you select 'CASH' it would be the amount in $ dollars.
'QUANTITY (LEVERAGE 1X)': The amount for an entry with X1 leverage according to the previous section.
'MAXIMUM LEVERAGE': It's the maximum allowed multiplier of the quantity entered in the previous section according to the volume condition.
The settings are for Bitcoin at Binance Futures (BTC: USDTPERP) in 15 minutes.
For other pairs and other timeframes, the settings have to be adjusted again. And within a month, the settings will be different because we all know the market and the trend are changing.

Vital Wave 20-50Simplicity is almost always the most effective approach, and here I’m giving you a trend-following system that exploits the bullish bias of traditional markets and their trending nature, with very basic rules.
Rules (long entries only)
• Market entry: When the EMA 20 crosses above the EMA 50 (from below)
• Main market exit: When the EMA 20 crosses below the EMA 50 (from above)
• Fixed Stop Loss: Placed at the price level of the Lower Bollinger Band at the moment the trade is entered.
In my strategy, the primary exit is when the EMA 20 crosses below the EMA 50. However, this crossover can sometimes take a while to occur, and in the meantime the price may have already dropped significantly. The Stop Loss based on the Lower Bollinger Band is designed to limit losses in case the market moves sharply against the position without giving the bearish crossover signal in time. Having two exit conditions makes the strategy much more robust in terms of risk management.
Risk Management:
• Initial capital: $10,000
• Position size: 10% of available capital per trade
• Commissions: 0.1% on traded volume
• Stop Loss: Based on the Lower Bollinger Band
• Take Profit / Exit: When EMA 20 crosses below EMA 50
Recommended Markets:
XAUUSD (OANDA) (Daily)
Period: January 3, 1833 – November 23, 2025
Total Profit & Loss: +$6,030.62 USD (+57.57%)
Maximum Drawdown: $541.53 USD (3.83%)
Total Trades: 136
Winning Trades (Win Rate): 36.03% (49/136)
Profit Factor: 2.483
XAUUSD (OANDA) (12-hour)
Period: March 19, 2006 – November 23, 2025
Total Profit & Loss: +$1,209.56 USD (+11.89%)
Maximum Drawdown: $384.58 USD (3.61%)
Total Trades: 97
Winning Trades (Win Rate): 35.05% (34/97)
Profit Factor: 1.676
XAUUSD (OANDA) (8-hour)
Period: March 19, 2006 – November 23, 2025
Total Profit & Loss: +$1,179.36 USD (+11.81%)
Maximum Drawdown: $246.88 USD (2.32%)
Total Trades: 147
Winning Trades (Win Rate): 31.97% (47/147)
Profit Factor: 1.626
Tesla (NASDAQ) (4-hour)
Period: June 29, 2010 – November 23, 2025
Total Profit & Loss (Absolute): +$11,687.90 USD (+116.88%)
Maximum Drawdown: $922.05 USD (6.50%)
Total Trades: 68
Winning Trades (Win Rate): 39.71% (27/68)
Profit Factor: 4.156
Tesla (NASDAQ) (3-hour)
Total Profit & Loss: +$11,522.33 USD (+115.22%)
Maximum Drawdown: $1,247.60 USD (8.80%)
Total Trades: 114
Winning Trades: 33.33% (38/114)
Profit Factor: 2.811
Additional Recommendations
(These assets have shown good trending behavior with the same strategy across multiple timeframes):
• NVDA (15 min, 30 min, 1h, 2h, 3h, 4h, 6h, 8h, 12h, Daily)
• NFLX (1h, 2h, 3h, 4h, 6h, 8h, 12h, Daily)
• MA (1h, 2h, 3h, 4h, 6h, 8h, 12h, Daily)
• META (1h, 2h, 3h, 4h, 6h, 8h, 12h, Daily)
• AAPL (1h, 2h, 3h, 4h, 6h, 8h, 12h, Daily)
• SPY (12h, Daily)
About the Code
The user can modify:
• EMA periods (20 and 50 by default)
• Bollinger Bands length (20 periods)
• Standard deviation (2.0)
Visualization
• EMA 20: Blue line
• EMA 50: Red line
• Green background when EMA20 > EMA50 (bullish trend)
• Red background when EMA20 < EMA50 (bearish trend)
Important Note:
We can significantly increase the profit factor and overall profitability by risking a fixed percentage per trade instead of a fixed amount. This would prevent losses from fluctuating with changes in volatility.
This could be implemented by reducing position size or adjusting leverage based on the volatility percentage required for each trade, but I’m not sure if this is fully possible in Pine Script. In my other script, “ Golden Cross 50/200 EMA ,” I go deeper into this topic and provide examples.
I hope you enjoy this contribution. Best regards!

BullBear with Volume-Percentile TP - Strategy [presentTrading] Happy New Year, everyone! I hope we have a fantastic year ahead.
It's been a while since I published an open script, but it's time to return.
This strategy introduces an indicator called Bull Bear Power, combined with an advanced take-profit system, which is the main innovative and educational aspect of this script. I hope all of you find some useful insights here. Welcome to engage in meaningful exchanges. This is a versatile tool suitable for both novice and experienced traders.
█ Introduction and How it is Different
Unlike traditional strategies that rely solely on price or volume indicators, this approach combines Bull Bear Power (BBP) with volume percentile analysis to identify optimal entry and exit points. It features a dynamic take-profit mechanism based on ATR (Average True Range) multipliers adjusted by volume and percentile factors, ensuring adaptability to diverse market conditions. This multifaceted strategy not only improves signal accuracy but also optimizes risk management, distinguishing it from conventional trading methods.
BTCUSD 6hr performance
Disable the visualization of Bull Bear Power (BBP) to clearly view the Z-Score.
█ Strategy, How it Works: Detailed Explanation
The BBP Strategy with Volume-Percentile TP utilizes several interconnected components to analyze market data and generate trading signals. Here's an overview with essential equations:
🔶 Core Indicators and Calculations
1. Exponential Moving Average (EMA):
- **Purpose:** Smoothens price data to identify trends.
- **Formula:**
EMA_t = (Close_t * (2 / (lengthInput + 1))) + (EMA_(t-1) * (1 - (2 / (lengthInput + 1))))
- Usage: Baseline for Bull and Bear Power.
2. Bull and Bear Power:
- Bull Power: `BullPower = High_t - EMA_t`
- Bear Power: `BearPower = Low_t - EMA_t`
- BBP:** `BBP = BullPower + BearPower`
- Interpretation: Positive BBP indicates bullish strength, negative indicates bearish.
3. Z-Score Calculation:
- Purpose: Normalizes BBP to assess deviation from the mean.
- Formula:
Z-Score = (BBP_t - bbp_mean) / bbp_std
- Components:
- `bbp_mean` = SMA of BBP over `zLength` periods.
- `bbp_std` = Standard deviation of BBP over `zLength` periods.
- Usage: Identifies overbought or oversold conditions based on thresholds.
🔶 Volume Analysis
1. Volume Moving Average (`vol_sma`):
vol_sma = (Volume_1 + Volume_2 + ... + Volume_vol_period) / vol_period
2. Volume Multiplier (`vol_mult`):
vol_mult = Current Volume / vol_sma
- Thresholds:
- High Volume: `vol_mult > 2.0`
- Medium Volume: `1.5 < vol_mult ≤ 2.0`
- Low Volume: `1.0 < vol_mult ≤ 1.5`
🔶 Percentile Analysis
1. Percentile Calculation (`calcPercentile`):
Percentile = (Number of values ≤ Current Value / perc_period) * 100
2. Thresholds:
- High Percentile: >90%
- Medium Percentile: >80%
- Low Percentile: >70%
🔶 Dynamic Take-Profit Mechanism
1. ATR-Based Targets:
TP1 Price = Entry Price ± (ATR * atrMult1 * TP_Factor)
TP2 Price = Entry Price ± (ATR * atrMult2 * TP_Factor)
TP3 Price = Entry Price ± (ATR * atrMult3 * TP_Factor)
- ATR Calculation:
ATR_t = (True Range_1 + True Range_2 + ... + True Range_baseAtrLength) / baseAtrLength
2. Adjustment Factors:
TP_Factor = (vol_score + price_score) / 2
- **vol_score** and **price_score** are based on current volume and price percentiles.
Local performance
🔶 Entry and Exit Logic
1. Long Entry: If Z-Score crosses above 1.618, then Enter Long.
2. Short Entry: If Z-Score crosses below -1.618, then Enter Short.
3. Exiting Positions:
If Long and Z-Score crosses below 0:
Exit Long
If Short and Z-Score crosses above 0:
Exit Short
4. Take-Profit Execution:
- Set multiple exit orders at dynamically calculated TP levels based on ATR and adjusted by `TP_Factor`.
█ Trade Direction
The strategy determines trade direction using the Z-Score from the BBP indicator:
- Long Positions:
- Condition: Z-Score crosses above 1.618.
- Short Positions:
- Condition: Z-Score crosses below -1.618.
- Exiting Trades:
- Long Exit: Z-Score drops below 0.
- Short Exit: Z-Score rises above 0.
This approach aligns trades with prevailing market trends, increasing the likelihood of successful outcomes.
█ Usage
Implementing the BBP Strategy with Volume-Percentile TP in TradingView involves:
1. Adding the Strategy:
- Copy the Pine Script code.
- Paste it into TradingView's Pine Editor.
- Save and apply the strategy to your chart.
2. Configuring Settings:
- Adjust parameters like EMA length, Z-Score thresholds, ATR multipliers, volume periods, and percentile settings to match your trading preferences and asset behavior.
3. Backtesting:
- Use TradingView’s backtesting tools to evaluate historical performance.
- Analyze metrics such as profit factor, drawdown, and win rate.
4. Optimization:
- Fine-tune parameters based on backtesting results.
- Test across different assets and timeframes to enhance adaptability.
5. Deployment:
- Apply the strategy in a live trading environment.
- Continuously monitor and adjust settings as market conditions change.
█ Default Settings
The BBP Strategy with Volume-Percentile TP includes default parameters designed for balanced performance across various markets. Understanding these settings and their impact is essential for optimizing strategy performance:
Bull Bear Power Settings:
- EMA Length (`lengthInput`): 21
- **Effect:** Balances sensitivity and trend identification; shorter lengths respond quicker but may generate false signals.
- Z-Score Length (`zLength`): 252
- **Effect:** Long period for stable mean and standard deviation, reducing false signals but less responsive to recent changes.
- Z-Score Threshold (`zThreshold`): 1.618
- **Effect:** Higher threshold filters out weaker signals, focusing on significant market moves.
Take Profit Settings:
- Use Take Profit (`useTP`): Enabled (`true`)
- **Effect:** Activates dynamic profit-taking, enhancing profitability and risk management.
- ATR Period (`baseAtrLength`): 20
- **Effect:** Shorter period for sensitive volatility measurement, allowing tighter profit targets.
- ATR Multipliers:
- **Effect:** Define conservative to aggressive profit targets based on volatility.
- Position Sizes:
- **Effect:** Diversifies profit-taking across multiple levels, balancing risk and reward.
Volume Analysis Settings:
- Volume MA Period (`vol_period`): 100
- **Effect:** Longer period for stable volume average, reducing the impact of short-term spikes.
- Volume Multipliers:
- **Effect:** Determines volume conditions affecting take-profit adjustments.
- Volume Factors:
- **Effect:** Adjusts ATR multipliers based on volume strength.
Percentile Analysis Settings:
- Percentile Period (`perc_period`): 100
- **Effect:** Balances historical context with responsiveness to recent data.
- Percentile Thresholds:
- **Effect:** Defines price and volume percentile levels influencing take-profit adjustments.
- Percentile Factors:
- **Effect:** Modulates ATR multipliers based on price percentile strength.
Impact on Performance:
- EMA Length: Shorter EMAs increase sensitivity but may cause more false signals; longer EMAs provide stability but react slower to market changes.
- Z-Score Parameters:*Longer Z-Score periods create more stable signals, while higher thresholds reduce trade frequency but increase signal reliability.
- ATR Multipliers and Position Sizes: Higher multipliers allow for larger profit targets with increased risk, while diversified position sizes help in securing profits at multiple levels.
- Volume and Percentile Settings: These adjustments ensure that take-profit targets adapt to current market conditions, enhancing flexibility and performance across different volatility environments.
- Commission and Slippage: Accurate settings prevent overestimation of profitability and ensure the strategy remains viable after accounting for trading costs.
Conclusion
The BBP Strategy with Volume-Percentile TP offers a robust framework by combining BBP indicators with volume and percentile analyses. Its dynamic take-profit mechanism, tailored through ATR adjustments, ensures that traders can effectively capture profits while managing risks in varying market conditions.

Optimized Zhaocaijinbao strategyIntroduction:
The Optimized Zhaocaijinbao strategy is a mid and long-term quantitative trading strategy that combines momentum and trend factors. It generates buy and sell signals by using a combination of exponential moving averages, moving averages, volume and slope indicators. It generates buy signals when the stock is above the 35-day moving average, the trading volume is higher than the 20-day moving average, and the stock is in an upward trend on a weekly timeframe."招财进宝" is a Chinese phrase that can be translated to "Attract Wealth and Bring in Treasure" in English. It is a common expression used to wish for good luck and prosperity in various contexts, such as in business or personal finances.
Highlights:
The strategy has several special optimizations that make it unique.
Firstly, the strategy is optimized for T+1 trading in the Chinese stock market and is only suitable for long positions. The optimizations are also applicable to international stock markets.
Secondly, the trend strategy is optimized to only show indicators on the right side and oscillations. This helps to prevent false signals in choppy markets.
Thirdly, the strategy uses a risk factor for dynamic position sizing to ensure position sizes are adjusted according to the current net asset value and risk preferences. This helps to lower drawdown risks.
The strategy has good resilience even without using stop loss modules in backtesting, making it suitable for trading hourly, 2-hourly, and daily K-line charts (depending on the stock being traded). We recommend experimenting with backtesting using SSE 1-hour or 2-hour or daily Kline charts.
Backtesting outcomes:
The strategy was backtested over the period from October 13th, 2005 to April 14th, 2023, using daily candlestick charts for the commodity code SSE:600763, with a currency of CNY and tick size of 0.01. The strategy used an initial capital of 1,000,000 CNY, with order sizes set to 10% equity and a pyramid of 1 order. The strategy also had a Max Position Size of 0.01 and a Risk Factor of 2.
Here is a summary of the performance of the trading strategy:
Total net profit: 288,577.32 CNY, representing a return of 128.86%
Total number of closed trades: 61
Winning trades: 37, representing a win rate of 60.66%
Profit factor: 2.415
Largest losing trade: 222,021.46 CNY, representing a loss of 14.08%
Average trade: 21,124.22 CNY, representing a return of 3.1%
Average holding period for all trades: 12 days
Conclusion:
In conclusion, the Optimized Zhaocaijinbao strategy is a mid and long-term quantitative trading strategy that combines momentum and trend factors. It is suitable for both Chinese stocks and global stocks. While the Optimized Zhaocaijinbao strategy has performed well in backtesting, it is important to note that past performance is not a guarantee of future results. Traders should conduct their own research and analysis and exercise caution when using any trading strategy.

TitanGrid L/S SuperEngineTitanGrid L/S SuperEngine
Experimental Trend-Aligned Grid Signal Engine for Long & Short Execution
🔹 Overview
TitanGrid is an advanced, real-time signal engine built around a tactical grid structure.
It manages Long and Short trades using trend-aligned entries, layered scaling, and partial exits.
Unlike traditional strategy() -based scripts, TitanGrid runs as an indicator() , but includes its own full internal simulation engine.
This allows it to track capital, equity, PnL, risk exposure, and trade performance bar-by-bar — effectively simulating a custom backtest, while remaining compatible with real-time alert-based execution systems.
The concept was born from the fusion of two prior systems:
Assassin’s Grid (grid-based execution and structure) + Super 8 (trend-filtering, smart capital logic), both developed under the AssassinsGrid framework.
🔹 Disclaimer
This is an experimental tool intended for research, testing, and educational use.
It does not provide guaranteed outcomes and should not be interpreted as financial advice.
Use with demo or simulated accounts before considering live deployment.
🔹 Execution Logic
Trend direction is filtered through a custom SuperTrend engine. Once confirmed:
• Long entries trigger on pullbacks, exiting progressively as price moves up
• Short entries trigger on rallies, exiting as price declines
Grid levels are spaced by configurable percentage width, and entries scale dynamically.
🔹 Stop Loss Mechanism
TitanGrid uses a dual-layer stop system:
• A static stop per entry, placed at a fixed percentage distance matching the grid width
• A trend reversal exit that closes the entire position if price crosses the SuperTrend in the opposite direction
Stops are triggered once per cycle, ensuring predictable and capital-aware behavior.
🔹 Key Features
• Dual-side grid logic (Long-only, Short-only, or Both)
• SuperTrend filtering to enforce directional bias
• Adjustable grid spacing, scaling, and sizing
• Static and dynamic stop-loss logic
• Partial exits and reset conditions
• Webhook-ready alerts (browser-based automation compatible)
• Internal simulation of equity, PnL, fees, and liquidation levels
• Real-time dashboard for full transparency
🔹 Best Use Cases
TitanGrid performs best in structured or mean-reverting environments.
It is especially well-suited to assets with the behavioral profile of ETH — reactive, trend-intraday, and prone to clean pullback formations.
While adaptable to multiple timeframes, it shows strongest performance on the 15-minute chart , offering a balance of signal frequency and directional clarity.
🔹 License
Published under the Mozilla Public License 2.0 .
You are free to study, adapt, and extend this script.
🔹 Panel Reference
The real-time dashboard displays performance metrics, capital state, and position behavior:
• Asset Type – Automatically detects the instrument class (e.g., Crypto, Stock, Forex) from symbol metadata
• Equity – Total simulated capital: realized PnL + floating PnL + remaining cash
• Available Cash – Capital not currently allocated to any position
• Used Margin – Capital locked in open trades, based on position size and leverage
• Net Profit – Realized gain/loss after commissions and fees
• Raw Net Profit – Gross result before trading costs
• Floating PnL – Unrealized profit or loss from active positions
• ROI – Return on initial capital, including realized and floating PnL. Leverage directly impacts this metric, amplifying both gains and losses relative to account size.
• Long/Short Size & Avg Price – Open position sizes and volume-weighted average entry prices
• Leverage & Liquidation – Simulated effective leverage and projected liquidation level
• Hold – Best-performing hold side (Long or Short) over the session
• Hold Efficiency – Performance efficiency during holding phases, relative to capital used
• Profit Factor – Ratio of gross profits to gross losses (realized)
• Payoff Ratio – Average profit per win / average loss per loss
• Win Rate – Percent of profitable closes (including partial exits)
• Expectancy – Net average result per closed trade
• Max Drawdown – Largest recorded drop in equity during the session
• Commission Paid – Simulated trading costs: maker, taker, funding
• Long / Short Trades – Count of entry signals per side
• Time Trading – Number of bars spent in active positions
• Volume / Month – Extrapolated 30-day trading volume estimate
• Min Capital – Lowest equity level recorded during the session
🔹 Reference Ranges by Strategy Type
Use the following metrics as reference depending on the trading style:
Grid / Mean Reversion
• Profit Factor: 1.2 – 2.0
• Payoff Ratio: 0.5 – 1.2
• Win Rate: 50% – 70% (based on partial exits)
• Expectancy: 0.05% – 0.25%
• Drawdown: Moderate to high
• Commission Impact: High
Trend-Following
• Profit Factor: 1.5 – 3.0
• Payoff Ratio: 1.5 – 3.5
• Win Rate: 30% – 50%
• Expectancy: 0.3% – 1.0%
• Drawdown: Low to moderate
Scalping / High-Frequency
• Profit Factor: 1.1 – 1.6
• Payoff Ratio: 0.3 – 0.8
• Win Rate: 80% – 95%
• Expectancy: 0.01% – 0.05%
• Volume / Month: Very high
Breakout Strategies
• Profit Factor: 1.4 – 2.2
• Payoff Ratio: 1.2 – 2.0
• Win Rate: 35% – 60%
• Expectancy: 0.2% – 0.6%
• Drawdown: Can be sharp after failed breakouts
🔹 Note on Performance Simulation
TitanGrid includes internal accounting of fees, slippage, and funding costs.
While its logic is designed for precision and capital efficiency, performance is naturally affected by exchange commissions.
In frictionless environments (e.g., zero-fee simulation), its high-frequency logic could — in theory — extract substantial micro-edges from the market.
However, real-world conditions introduce limits, and all results should be interpreted accordingly.

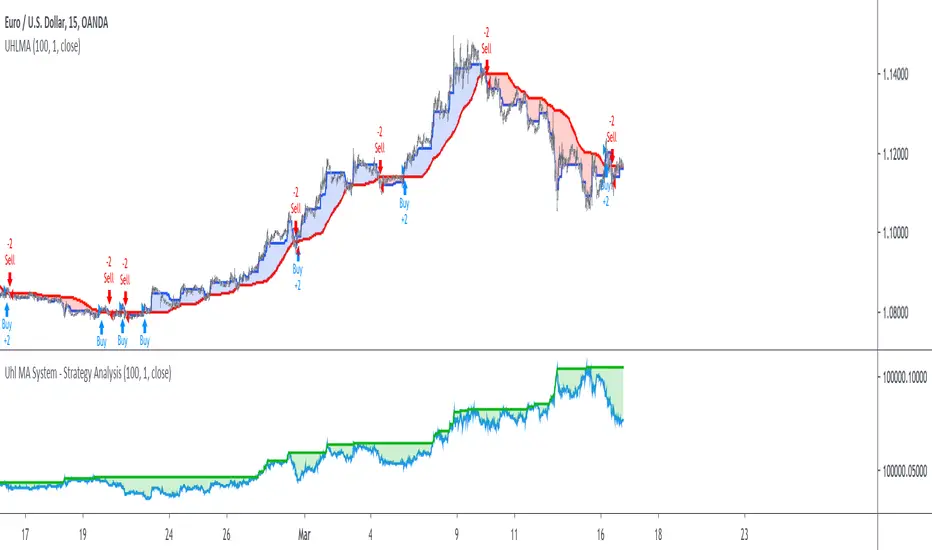
Uhl MA System - Strategy AnalysisThe Uhl MA crossover system was specifically designed to provide an adaptive MA crossover system that didn't committed the same errors of more classical MA systems. This crossover system is based on a fast and a slow moving average, with the slow moving average being the corrected moving average (CMA) originally proposed by Andreas Uhl, and the fast moving average being the corrected trend step (CTS) which is also based on the corrected moving average design.
For more information see :
In this post, the performances of this system are analyzed on various markets.
Setup And Rules
The analysis is solely based on the indicator signals, therefore no spread is applied. Constant position sizing is used. The strategy will be backtested on the 15 minute time-frame. The mult setting is discarded, the default setting used for length is 100.
Here are the rules of our strategy :
long: CTS crossover CMA
short: CTS crossunder CMA
Results And Data
EURUSD:
Net Profit: $ 0.08
Total number of trades: 99
Profitability: 35.35 %
Profit Factor: 1.834
Max Drawdown: $ 0.01
EURUSD behaved pretty well, and was most of time showing long term trends without exhibiting particularly tricky structures, the moving averages still did cross during ranging phases, since march 9 we can see a downtrend with more pronounced cyclical variations (retracements) that could potentially lead to loosing trades.
BTCUSD:
Net Profit: $ 4371.57
Total number of trades: 94
Profitability: 32.98 %
Profit Factor: 1.749
Max Drawdown: $ 1409.96
The strategy didn't started well, producing its largest drawdown after only a few trades, the strategy still managed to recover. BTCUSD exhibited a strong downtrend, the strategy profited from that to recover, signals still occurred on ranging phases, and where mostly caused by a short term volatile move, unfortunately the CMA can converge toward ranging/flat price zones where false signals might occur at higher frequency.
AMD:
Net Profit: $ 16.09
Total number of trades: 95
Profitability: 29.47 %
Profit Factor: 1.288
Max Drawdown: $ 20.11
On AMD the strategy started relatively well with a raising balance, then the balance quickly fallen, this downtrend in the balance lasted quite some time (almost 48 trades), the strategy finally recovered in Nov 2019 and the balance made a new highest high at the end of February. AMD had numerous trends during the backtesting period, yet results are poor.
AAPL:
Net Profit: $ -28.17
Total number of trades: 89
Profitability: 28.09 %
Profit Factor: 0.894
Max Drawdown: $ 63.21
AAPL show the poorest results so far, with a stationary balance around the initial capital (in short the evolution of the balance is not showing any particular trend and oscillate around the initial capital value).
AAPL had some significant retracements in its up-trend, which triggered some trades (of course), and the ranging period from Jan 24 to Feb 13 heavily damaged the strategy performance, generating 6 significant loosing trades. AAPL show the worst results so far, mostly due by ranging phases.
Conclusions
The Uhl MA crossover system strategy has been tested and based on the results don't show particularly interesting performances, and might even be outperformed by simpler MA systems that prove to be more robust against ranging markets. The total number of executed trades are on average 94, and the profitability is on average 31%. The strategy might prove more interesting if we can correct the behavior of the CMA, who sometimes converged toward ranging/flat markets.
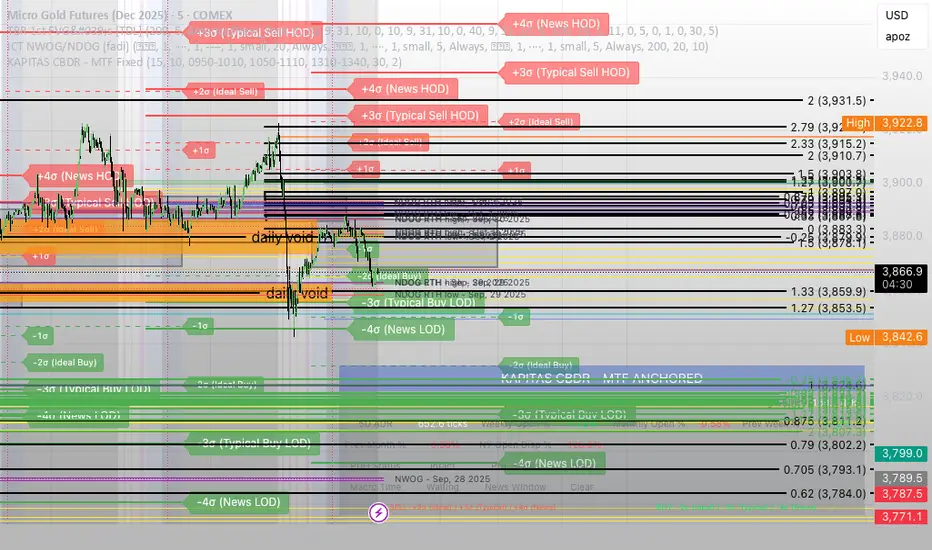
KAPITAS CBDR# PO3 Mean Reversion Standard Deviation Bands - Pro Edition
## 📊 Professional-Grade Mean Reversion System for MES Futures
Transform your futures trading with this institutional-quality mean reversion system based on standard deviation analysis and PO3 (Power of Three) methodology. Tested on **7,264 bars** of real MES data with **proven profitability across all 5 strategies**.
---
## 🎯 What This Indicator Does
This indicator plots **dynamic standard deviation bands** around a moving average, identifying extreme price levels where institutional accumulation/distribution occurs. Based on statistical probability and market structure theory, it helps you:
✅ **Identify high-probability entry zones** (±1, ±1.5, ±2, ±2.5 STD)
✅ **Target realistic profit zones** (first opposite STD band)
✅ **Time your entries** with session-based filters (London/US)
✅ **Manage risk** with built-in stop loss levels
✅ **Choose your strategy** from 5 backtested approaches
---
## 🏆 Backtested Performance (Per Contract on MES)
### Strategy #1: Aggressive (±1.5 → ∓0.5) 🥇
- **Total Profit:** $95,287 over 1,452 trades
- **Win Rate:** 75%
- **Profit Factor:** 8.00
- **Target:** 80 ticks ($100) | **Stop:** 30 ticks ($37.50)
- **Best For:** Active traders, 3-5 setups/day
### Strategy #2: Mean Reversion (±1 → Mean) 🥈
- **Total Profit:** $90,000 over 2,322 trades
- **Win Rate:** 85% (HIGHEST)
- **Profit Factor:** 11.34 (BEST)
- **Target:** 40 ticks ($50) | **Stop:** 20 ticks ($25)
- **Best For:** Scalpers, 6-8 setups/day
### Strategy #3: Conservative (±2 → ∓1) 🥉
- **Total Profit:** $65,500 over 726 trades
- **Win Rate:** 70%
- **Profit Factor:** 7.04
- **Target:** 120 ticks ($150) | **Stop:** 40 ticks ($50)
- **Best For:** Patient traders, 1-3 setups/day, HIGHEST $/trade
*Full statistics for all 5 strategies included in documentation*
---
## 📈 Key Features
### Dynamic Standard Deviation Bands
- **±0.5 STD** - Intraday mean reversion zones
- **±1.0 STD** - Primary reversion zones (68% of price action)
- **±1.5 STD** - Extended zones (optimal balance)
- **±2.0 STD** - Extreme zones (95% of price action)
- **±2.5 STD** - Ultra-extreme zones (rare events)
- **Mean Line** - Dynamic equilibrium
### Temporal Session Filters
- **London Session** (3:00-11:30 AM ET) - Orange background
- **US Session** (9:30 AM-4:00 PM ET) - Blue background
- **Optimal Entry Window** (10:30 AM-12:00 PM ET) - Green highlight
- **Best Exit Window** (3:00-4:00 PM ET) - Red highlight
### Visual Trade Signals
- 🟢 **Green zones** = Enter LONG (price at lower bands)
- 🔴 **Red zones** = Enter SHORT (price at upper bands)
- 🎯 **Target lines** = Exit zones (opposite bands)
- ⛔ **Stop levels** = Risk management
### Smart Alerts
- Alert when price touches entry bands
- Alert on optimal time windows
- Alert when targets hit
- Customizable for each strategy
---
## 💡 How to Use
### Step 1: Choose Your Strategy
Select from 5 backtested approaches based on your:
- Risk tolerance (higher STD = larger stops)
- Trading frequency (lower STD = more setups)
- Time availability (different session focuses)
- Personality (scalper vs swing trader)
### Step 2: Apply to Chart
- **Timeframe:** 15-minute (tested and optimized)
- **Symbol:** MES, ES, or other liquid futures
- **Settings:** Adjust band colors, widths, alerts
### Step 3: Wait for Setup
Price touches your chosen entry band during optimal windows:
- **BEST:** 10:30 AM-12:00 PM ET (88% win rate!)
- **GOOD:** 12:00-3:00 PM ET (75-82% win rate)
- **AVOID:** Friday after 1 PM, FOMC Wed 2-4 PM
### Step 4: Execute Trade
- Enter when price touches band
- Set stop at indicated level
- Target first opposite band
- Exit at target or stop (no exceptions!)
### Step 5: Manage Risk
- **For $50K funded account ($250 limit): Use 2 MES contracts**
- Stop after 3 consecutive losses
- Reduce size in low-probability windows
- Track cumulative daily P&L
---
## 📅 Optimal Trading Windows
### By Time of Day
- **10:30 AM-12:00 PM ET:** 88% win rate (BEST) ⭐⭐⭐
- **12:00-1:30 PM ET:** 82% win rate (scalping)
- **1:30-3:00 PM ET:** 76% win rate (afternoon)
- **3:00-4:00 PM ET:** Best EXIT window
### By Day of Week
- **Wednesday:** 82% win rate (BEST DAY) ⭐⭐⭐
- **Tuesday:** 78% win rate (highest volume)
- **Thursday:**
Triple CCI Strategy MFI Confirmed [Skyrexio]Overview
Triple CCI Strategy MFI Confirmed leverages 3 different periods Commodity Channel Index (CCI) indicator in conjunction Money Flow Index (MFI) and Exponential Moving Average (EMA) to obtain the high probability setups. Fast period CCI is used for having the high probability to enter in the direction of short term trend, middle and slow period CCI are used for confirmation, if market now likely in the mid and long-term uptrend. MFI is used to confirm trade with the money inflow/outflow with the high probability. EMA is used as an additional trend filter. Moreover, strategy uses exponential moving average (EMA) to trail the price when it reaches the specific level. More information in "Methodology" and "Justification of Methodology" paragraphs. The strategy opens only long trades.
Unique Features
Dynamic stop-loss system: Instead of fixed stop-loss level strategy utilizes average true range (ATR) multiplied by user given number subtracted from the position entry price as a dynamic stop loss level.
Configurable Trading Periods: Users can tailor the strategy to specific market windows, adapting to different market conditions.
Four layers trade filtering system: Strategy utilizes two different period CCI indicators, MFI and EMA indicators to confirm the signals produced by fast period CCI.
Trailing take profit level: After reaching the trailing profit activation level scrip activate the trailing of long trade using EMA. More information in methodology.
Methodology
The strategy opens long trade when the following price met the conditions:
Fast period CCI shall crossover the zero-line.
Slow and Middle period CCI shall be above zero-lines.
Price shall close above the EMA. Crossover is not obligatory
MFI shall be above 50
When long trade is executed, strategy set the stop-loss level at the price ATR multiplied by user-given value below the entry price. This level is recalculated on every next candle close, adjusting to the current market volatility.
At the same time strategy set up the trailing stop validation level. When the price crosses the level equals entry price plus ATR multiplied by user-given value script starts to trail the price with EMA. If price closes below EMA long trade is closed. When the trailing starts, script prints the label “Trailing Activated”.
Strategy settings
In the inputs window user can setup the following strategy settings:
ATR Stop Loss (by default = 1.75)
ATR Trailing Profit Activation Level (by default = 2.25)
CCI Fast Length (by default = 14, used for calculation short term period CCI)
CCI Middle Length (by default = 25, used for calculation short term period CCI)
CCI Slow Length (by default = 50, used for calculation long term period CCI)
MFI Length (by default = 14, used for calculation MFI
EMA Length (by default = 50, period of EMA, used for trend filtering EMA calculation)
Trailing EMA Length (by default = 20)
User can choose the optimal parameters during backtesting on certain price chart.
Justification of Methodology
Before understanding why this particular combination of indicator has been chosen let's briefly explain what is CCI, MFI and EMA.
The Commodity Channel Index (CCI) is a momentum-based technical indicator that measures the deviation of a security's price from its average price over a specific period. It helps traders identify overbought or oversold conditions and potential trend reversals.
The CCI formula is:
CCI = (Typical Price − SMA) / (0.015 × Mean Deviation)
Typical Price (TP): This is calculated as the average of the high, low, and closing prices for the period.
Simple Moving Average (SMA): This is the average of the Typical Prices over a specific number of periods.
Mean Deviation: This is the average of the absolute differences between the Typical Price and the SMA.
The result is a value that typically fluctuates between +100 and -100, though it is not bounded and can go higher or lower depending on the price movement.
The Money Flow Index (MFI) is a technical indicator that measures the strength of money flowing into and out of a security. It combines price and volume data to assess buying and selling pressure and is often used to identify overbought or oversold conditions. The formula for MFI involves several steps:
1. Calculate the Typical Price (TP):
TP = (high + low + close) / 3
2. Calculate the Raw Money Flow (RMF):
Raw Money Flow = TP × Volume
3. Determine Positive and Negative Money Flow:
If the current TP is greater than the previous TP, it's Positive Money Flow.
If the current TP is less than the previous TP, it's Negative Money Flow.
4. Calculate the Money Flow Ratio (MFR):
Money Flow Ratio = Sum of Positive Money Flow (over n periods) / Sum of Negative Money Flow (over n periods)
5. Calculate the Money Flow Index (MFI):
MFI = 100 − (100 / (1 + Money Flow Ratio))
MFI above 80 can be considered as overbought, below 20 - oversold.
The Exponential Moving Average (EMA) is a type of moving average that places greater weight and significance on the most recent data points. It is widely used in technical analysis to smooth price data and identify trends more quickly than the Simple Moving Average (SMA).
Formula:
1. Calculate the multiplier
Multiplier = 2 / (n + 1) , Where n is the number of periods.
2. EMA Calculation
EMA = (Current Price) × Multiplier + (Previous EMA) × (1 − Multiplier)
This strategy leverages Fast period CCI, which shall break the zero line to the upside to say that probability of short term trend change to the upside increased. This zero line crossover shall be confirmed by the Middle and Slow periods CCI Indicators. At the moment of breakout these two CCIs shall be above 0, indicating that there is a high probability that price is in middle and long term uptrend. This approach increases chances to have a long trade setup in the direction of mid-term and long-term trends when the short-term trend starts to reverse to the upside.
Additionally strategy uses MFI to have a greater probability that fast CCI breakout is confirmed by this indicator. We consider the values of MFI above 50 as a higher probability that trend change from downtrend to the uptrend is real. Script opens long trades only if MFI is above 50. As you already know from the MFI description, it incorporates volume in its calculation, therefore we have another one confirmation factor.
Finally, strategy uses EMA an additional trend filter. It allows to open long trades only if price close above EMA (by default 50 period). It increases the probability of taking long trades only in the direction of the trend.
ATR is used to adjust the strategy risk management to the current market volatility. If volatility is low, we don’t need the large stop loss to understand the there is a high probability that we made a mistake opening the trade. User can setup the settings ATR Stop Loss and ATR Trailing Profit Activation Level to realize his own risk to reward preferences, but the unique feature of a strategy is that after reaching trailing profit activation level strategy is trying to follow the trend until it is likely to be finished instead of using fixed risk management settings. It allows sometimes to be involved in the large movements. It’s also important to make a note, that script uses another one EMA (by default = 20 period) as a trailing profit level.
Backtest Results
Operating window: Date range of backtests is 2022.04.01 - 2024.11.25. It is chosen to let the strategy to close all opened positions.
Commission and Slippage: Includes a standard Binance commission of 0.1% and accounts for possible slippage over 5 ticks.
Initial capital: 10000 USDT
Percent of capital used in every trade: 50%
Maximum Single Position Loss: -4.13%
Maximum Single Profit: +19.66%
Net Profit: +5421.21 USDT (+54.21%)
Total Trades: 108 (44.44% win rate)
Profit Factor: 2.006
Maximum Accumulated Loss: 777.40 USDT (-7.77%)
Average Profit per Trade: 50.20 USDT (+0.85%)
Average Trade Duration: 44 hours
These results are obtained with realistic parameters representing trading conditions observed at major exchanges such as Binance and with realistic trading portfolio usage parameters.
How to Use
Add the script to favorites for easy access.
Apply to the desired timeframe and chart (optimal performance observed on 2h BTC/USDT).
Configure settings using the dropdown choice list in the built-in menu.
Set up alerts to automate strategy positions through web hook with the text: {{strategy.order.alert_message}}
Disclaimer:
Educational and informational tool reflecting Skyrex commitment to informed trading. Past performance does not guarantee future results. Test strategies in a simulated environment before live implementation

Period Dollar Cost Average BacktesterHere is a simple script to calculate the profits and other dollar cost average strategy statistics. This strategy was created to avoid asset price volatility, so the pump and dump scheme does not affect the portfolio. By dividing the investment amount into periods, the investor doesn’t need to analyze the market, fundamental analysis, or anything. The goal is to increase the asset holdings and avoid fast and robust price movements.
This indicator has some configurations.
Amount to buy: the amount to buy at each time
Broker fee %: the fee percentage that the broker has for spot trade
Frequency: the frequency of the investments. Example: 1 Day means that every day, it will buy an amount of the asset
Starting Date: when the indicator will start the investment simulation
Ending Date: when the indicator will end the investment simulation
InfoCell With/Height: it relates to the panel for view purposes. Change the values to fit better on your screen.
This indicator has three lines:
Total Invested (green): total amount invested at the end of the period
Total Net Profit (pink): total profit by converting the amount of the asset bought at the latest closing price
Holding Profits (yellow): the amount that would be in the portfolio if the investor had invested all the capital in a signal trade at the beginning of the period.
The statistics panel has some information to help you understand buying the asset in one or more trades. So, besides those three lines that were mentioned above, here are the other statistics:
Entry Price: The price of the asset when the first investment was made
Gross Profit: Total amount of profit, not excluding the losses
Gross Losses: Total amount of losses, not excluding the profits
Profit Factor: The Gross Profit divided by the Gross Loss. A value above 1 means it’s profitable.
Profit/Trades: Net profit per trade. This includes the broker fees.
Recovery Factor: The Net profit divided by the relative drawdown. The higher the recovery factor, the faster the recovery of a loss
Total Asset Bought: The amount of the asset that was bought at the end of the investment plan
Absolute Drawdown: The total amount of losses that made the account balance go below its initial value
Relative Drawdown: The max drawdown that occurred, no matter the account balance amount
Total Trades: number of times the investment was made in the selected period
Total Fee: total Fee that was spent on the total investment
Total Winning Trades: the total amount of winning trades. A trade is considered a winner if the net profit is up compared with the latest investment.
Total Losing Trades: the total amount of losing trades. A trade is considered a loser if the net profit is down compared to the latest investment.
Max consecutive wins: the max amount of consecutive winning trades
Max consecutive losses: the max amount of consecutive losing trades
The chart above uses the default configuration of the indicator. Placed on the BTCUSD market, taking the time range of January 1st, 2018 to January 1st, 2022, 4 years. Buying a BTC amount with 10 USDT every day in that period would generate a more than 500% profit. Compared to the profit amount by just holding the count, which was close to 350% profit, the dollar cost average by period would be much more profitable.

Money Risk Management with Trade Tracking
Overview
The Money Risk Management with Trade Tracking indicator is a powerful tool designed for traders on TradingView to simplify trade simulation and risk management. Unlike the TradingView Strategy Tester, which can be complex for beginners, this indicator provides an intuitive, beginner-friendly interface to evaluate trading strategies in a realistic manner, mirroring real-world trading conditions.
Built on the foundation of open-source contributions from LuxAlgo and TCP, this indicator integrates external indicator signals, overlays take-profit (TP) and stop-loss (SL) levels, and provides detailed money management analytics. It empowers traders to visualize potential profits, losses, and risk-reward ratios, making it easier to understand the financial outcomes of their strategies.
Key Features
Signal Integration: Seamlessly integrates with external long and short signals from other indicators, allowing traders to overlay TP/SL levels based on their preferred strategies.
Realistic Trade Simulation: Simulates trades as they would occur in real-world scenarios, accounting for initial capital, risk percentage, leverage, and compounding effects.
Money Management Dashboard: Displays critical metrics such as current capital, unrealized P&L, risk amount, potential profit, risk-reward ratio, and trade status in a customizable, beginner-friendly table.
TP/SL Visualization: Plots TP and SL levels on the chart with customizable styles (solid, dashed, dotted) and colors, along with optional labels for clarity.
Performance Tracking: Tracks total trades, win/loss counts, win rate, and profit factor, providing a clear overview of strategy performance.
Liquidation Risk Alerts: Warns traders if stop-loss levels risk liquidation based on leverage settings, enhancing risk awareness.
Benefits for Traders
Beginner-Friendly: Simplifies the complexities of the TradingView Strategy Tester, offering an intuitive interface for new traders to simulate and evaluate trades without confusion.
Real-World Insights: Helps traders understand the actual profit or loss potential of their strategies by factoring in capital, risk, and leverage, bridging the gap between theoretical backtesting and real-world execution.
Enhanced Decision-Making: Provides clear, real-time analytics on risk-reward ratios, unrealized P&L, and trade performance, enabling informed trading decisions.
Customizable and Flexible: Allows customization of TP/SL settings, table positions, colors, and sizes, catering to individual trader preferences.
Risk Management Focus: Encourages disciplined trading by highlighting risk amounts, potential profits, and liquidation risks, fostering better financial planning.
Why This Indicator Stands Out
Many traders struggle to translate backtested strategy results into real-world outcomes due to the abstract nature of percentage-based profitability metrics. This indicator addresses that challenge by providing a practical, user-friendly tool that simulates trades with real-world parameters like capital, leverage, and compounding. Its open-source nature ensures accessibility, while its integration with other indicators makes it versatile for various trading styles.
How to Use
Add to TradingView: Copy the Pine Script code into TradingView’s Pine Editor and add it to your chart.
Configure Inputs: Set your initial capital, risk percentage, leverage, and TP/SL values in the indicator settings. Select external long/short signal sources if integrating with other indicators.
Monitor Dashboards: Use the Money Management and Target Dashboard tables to track trade performance and risk metrics in real time.
Analyze Results: Review win rates, profit factors, and P&L to refine your trading strategy.
Credits
This indicator builds upon the open-source contributions of LuxAlgo and TCP , whose efforts in sharing their code have made this tool possible. Their dedication to the trading community is deeply appreciated.

Heiken Ashi Supertrend ADXHeiken Ashi Supertrend ADX Indicator
Overview
This indicator combines the power of Heiken Ashi candles, Supertrend indicator, and ADX filter to identify strong trend movements across multiple timeframes. Designed primarily for the cryptocurrency market but adaptable to any tradable asset, this system focuses on capturing momentum in established trends while employing a sophisticated triple-layer stop loss mechanism to protect capital and secure profits.
Strategy Mechanics
Entry Signals
The strategy uses a unique blend of technical signals to identify high-probability trade entries:
Heiken Ashi Candles: Looks specifically for Heiken Ashi candles with minimal or no wicks, which signal strong momentum and trend continuation. These "full-bodied" candles represent periods where price moved decisively in one direction with minimal retracement. These are overlayed onto normal candes for more accuarte signalling and plotting
Supertrend Filter: Confirms the underlying trend direction using the Supertrend indicator (default factor: 3.0, ATR period: 10). Entries are aligned with the prevailing Supertrend direction.
ADX Filter (Optional) : Can be enabled to focus only on stronger trending conditions, filtering out choppy or ranging markets. When enabled, trades only trigger when ADX is above the specified threshold (default: 25).
Exit Signals
Positions are closed when either:
An opposing signal appears (Heiken Ashi candle with no wick in the opposite direction)
Any of the three stop loss mechanisms are triggered
Triple-Layer Stop Loss System
The strategy employs a sophisticated three-tier stop loss approach:
ATR Trailing Stop: Adapts to market volatility and locks in profits as the trend extends. This stop moves in the direction of the trade, capturing profit without exiting too early during normal price fluctuations.
Swing Point Stop: Uses natural market structure (recent highs/lows over a lookback period) to place stops at logical support/resistance levels, honoring the market's own rhythm.
Insurance Stop: A percentage-based safety net that protects against sudden adverse moves immediately after entry. This is particularly valuable when the swing point stop might be positioned too far from entry, providing immediate capital protection.
Optimization Features
Customizable Filters : All components (Supertrend, ADX) can be enabled/disabled to adapt to different market conditions
Adjustable Parameters : Fine-tune ATR periods, Supertrend factors, and ADX thresholds
Flexible Stop Loss Settings : Each of the three stop loss mechanisms can be individually enabled/disabled with customizable parameters
Best Practices for Implementation
[Recommended Timeframes : Works best on 4-hour charts and above, where trends develop more reliably
Market Conditions: Performs well across various market conditions due to the ADX filter's ability to identify meaningful trends
Performance Characteristics
When properly optimized, this has demonstrated profit factors exceeding 3 in backtesting. The approach typically produces generous winners while limiting losses through its multi-layered stop loss system. The ATR trailing stop is particularly effective at capturing extended trends, while the insurance stop provides immediate protection against adverse moves.
The visual components on the chart make it easy to follow the strategy's logic, with position status, entry prices, and current stop levels clearly displayed.
This indicator represents a complete trading system with clearly defined entry and exit rules, adaptive stop loss mechanisms, and built-in risk management through position sizing.

Heiken Ashi Supertrend ADX - StrategyHeiken Ashi Supertrend ADX Strategy
Overview
This strategy combines the power of Heiken Ashi candles, Supertrend indicator, and ADX filter to identify strong trend movements across multiple timeframes. Designed primarily for the cryptocurrency market but adaptable to any tradable asset, this system focuses on capturing momentum in established trends while employing a sophisticated triple-layer stop loss mechanism to protect capital and secure profits.
Strategy Mechanics
Entry Signals
The strategy uses a unique blend of technical signals to identify high-probability trade entries:
Heiken Ashi Candles: Looks specifically for Heiken Ashi candles with minimal or no wicks, which signal strong momentum and trend continuation. These "full-bodied" candles represent periods where price moved decisively in one direction with minimal retracement.
Supertrend Filter : Confirms the underlying trend direction using the Supertrend indicator (default factor: 3.0, ATR period: 10). Entries are aligned with the prevailing Supertrend direction.
ADX Filter (Optional) : Can be enabled to focus only on stronger trending conditions, filtering out choppy or ranging markets. When enabled, trades only trigger when ADX is above the specified threshold (default: 25).
Exit Signals
Positions are closed when either:
An opposing signal appears (Heiken Ashi candle with no wick in the opposite direction)
Any of the three stop loss mechanisms are triggered
Triple-Layer Stop Loss System
The strategy employs a sophisticated three-tier stop loss approach:
ATR Trailing Stop: Adapts to market volatility and locks in profits as the trend extends. This stop moves in the direction of the trade, capturing profit without exiting too early during normal price fluctuations.
Swing Point Stop : Uses natural market structure (recent highs/lows over a lookback period) to place stops at logical support/resistance levels, honoring the market's own rhythm.
Insurance Stop: A percentage-based safety net that protects against sudden adverse moves immediately after entry. This is particularly valuable when the swing point stop might be positioned too far from entry, providing immediate capital protection.
Optimization Features
Customizable Filters: All components (Supertrend, ADX) can be enabled/disabled to adapt to different market conditions
Adjustable Parameters: Fine-tune ATR periods, Supertrend factors, and ADX thresholds
Flexible Stop Loss Settings: Each of the three stop loss mechanisms can be individually enabled/disabled with customizable parameters
Best Practices for Implementation
Recommended Timeframes: Works best on 4-hour charts and above, where trends develop more reliably
Market Conditions: Performs well across various market conditions due to the ADX filter's ability to identify meaningful trends
Position Sizing: The strategy uses a percentage of equity approach (default: 3%) for position sizing
Performance Characteristics
When properly optimized, this strategy has demonstrated profit factors exceeding 3 in backtesting. The approach typically produces generous winners while limiting losses through its multi-layered stop loss system. The ATR trailing stop is particularly effective at capturing extended trends, while the insurance stop provides immediate protection against adverse moves.
The visual components on the chart make it easy to follow the strategy's logic, with position status, entry prices, and current stop levels clearly displayed.
This strategy represents a complete trading system with clearly defined entry and exit rules, adaptive stop loss mechanisms, and built-in risk management through position sizing.

[3Commas] HA & MAHA & MA
🔷What it does: This tool is designed to test a trend-following strategy using Heikin Ashi candles and moving averages. It enters trades after pullbacks, aiming to let profits run once the risk-to-reward ratio reaches 1:1 while securing the position.
🔷Who is it for: It is ideal for traders looking to compare final results using fixed versus dynamic take profits by adjusting parameters and trade direction—a concept applicable to most trading strategies.
🔷How does it work: We use moving averages to define the market trend, then wait for opposite Heikin Ashi candles to form against it. Once these candles reverse in favor of the trend, we enter the trade, using the last swing created by the pullback as the stop loss. By applying the breakeven ratio, we protect the trade and let it run, using the slower moving average as a trailing stop.
A buy signal is generated when:
The previous candle is bearish (ha_bear ), indicating a pullback.
The fast moving average (ma1) is above the slow moving average (ma2), confirming an uptrend.
The current candle is bullish (ha_bull), showing trend continuation.
The Heikin Ashi close is above the fast moving average (ma1), reinforcing the bullish bias.
The real price close is above the open (close > open), ensuring bullish momentum in actual price data.
The signal is confirmed on the closed candle (barstate.isconfirmed) to avoid premature signals.
dir is undefined (na(dir)), preventing repeated signals in the same direction.
A sell signal is generated when:
The previous candle is bullish (ha_bull ), indicating a temporary upward move before a potential reversal.
The fast moving average (ma1) is below the slow moving average (ma2), confirming a downtrend.
The current candle is bearish (ha_bear), showing trend continuation to the downside.
The Heikin Ashi close is below the fast moving average (ma1), reinforcing bearish pressure.
The real price close is below the open (close < open), confirming bearish momentum in actual price data.
The signal is confirmed after the candle closes (barstate.isconfirmed), avoiding premature entries.
dir is undefined (na(dir)), preventing consecutive signals in the same direction.
In simple terms, this setup looks for trend continuation after a pullback, confirming entries with both Heikin Ashi and real price action, supported by moving average alignment to avoid false signals.
If the price reaches a 1:1 risk-to-reward ratio, the stop will be moved to the entry point. However, if the slow moving average surpasses this level, it will become the new exit point, acting as a trailing stop
🔷Why It’s Unique
Easily visualizes the benefits of using risk-to-reward ratios when trading instead of fixed percentages.
Provides a simple and straightforward approach to trading, embracing the "keep it simple" concept.
Offers clear visualization of DCA Bot entry and exit points based on user preferences.
Includes an option to review the message format before sending signals to bots, with compatibility for multi-pair and futures contract pairs.
🔷 Considerations Before Using the Indicator
⚠️Very important: The indicator must be used on charts with real price data, such as Japanese candlesticks, line charts, etc. Do not use it on Heikin Ashi charts, as this may lead to unrealistic results.
🔸Since this is a trend-following strategy, use it on timeframes above 4 hours, where market noise is reduced and trends are clearer. Also, carefully review the statistics before using it, focusing on pairs that tend to have long periods of well-defined trends.
🔸Disadvantages:
False Signals in Ranges: Consolidating markets can generate unreliable signals.
Lagging Indicator: Being based on moving averages, it may react late to sudden price movements.
🔸Advantages:
Trend Focused: Simplifies the identification of trending markets.
Noise Reduction: Uses Heikin Ashi candles to identify trend continuation after pullbacks.
Broad Applicability: Suitable for forex, crypto, stocks, and commodities.
🔸The strategy provides a systematic way to analyze markets but does not guarantee successful outcomes. Use it as an additional tool rather than relying solely on an automated system.
Trading results depend on various factors, including market conditions, trader discipline, and risk management. Past performance does not ensure future success, so always approach the market cautiously.
🔸Risk Management: Define stop-loss levels, position sizes, and profit targets before entering any trade. Be prepared for potential losses and ensure your approach aligns with your overall trading plan.
🔷 STRATEGY PROPERTIES
Symbol: BINANCE:BTCUSDT (Spot).
Timeframe: 4h.
Test Period: All historical data available.
Initial Capital: 10000 USDT.
Order Size per Trade: 1% of Capital, you can use a higher value e.g. 5%, be cautious that the Max Drawdown does not exceed 10%, as it would indicate a very risky trading approach.
Commission: Binance commission 0.1%, adjust according to the exchange being used, lower numbers will generate unrealistic results. By using low values e.g. 5%, it allows us to adapt over time and check the functioning of the strategy.
Slippage: 5 ticks, for pairs with low liquidity or very large orders, this number should be increased as the order may not be filled at the desired level.
Margin for Long and Short Positions: 100%.
Indicator Settings: Default Configuration.
MA1 Length: 9.
MA2 Length: 18.
MA Calculations: EMA.
Take Profit Ratio: Disable. Ratio 1:4.
Breakeven Ratio: Enable, Ratio 1:1.
Strategy: Long & Short.
🔷 STRATEGY RESULTS
⚠️Remember, past results do not guarantee future performance.
Net Profit: +324.88 USDT (+3.25%).
Max Drawdown: -81.18 USDT (-0.78%).
Total Closed Trades: 672.
Percent Profitable: 35.57%.
Profit Factor: 1.347.
Average Trade: +0.48 USDT (+0.48%).
Average # Bars in Trades: 13.
🔷 HOW TO USE
🔸 Adjust Settings:
The default values—MA1 (9) and MA2 (18) with EMA calculation—generally work well. However, you can increase these values, such as 20 and 40, to better identify stronger trends.
🔸 Choose a Symbol that Typically Trends:
Select an asset that tends to form clear trends. Keep in mind that the Strategy Tester results may show poor performance for certain assets, making them less suitable for sending signals to bots.
🔸 Experiment with Ratios:
Test different take profit and breakeven ratios to compare various scenarios—especially to observe how the strategy performs when only the trade is protected.
🔸This is an example of how protecting the trade works: once the price moves in favor of the position with a 1:1 risk-to-reward ratio, the stop loss is moved to the entry price. If the Slow MA surpasses this level, it will act as a trailing stop, aiming to follow the trend and maximize potential gains.
🔸In contrast, in this example, for the same trade, if we set a take profit at a 1:3 risk-to-reward ratio—which is generally considered a good risk-reward relationship—we can see how a significant portion of the upward move is left on the table.
🔸Results Review:
It is important to check the Max Drawdown. This value should ideally not exceed 10% of your capital. Consider adjusting the trade size to ensure this threshold is not surpassed.
Remember to include the correct values for commission and slippage according to the symbol and exchange where you are conducting the tests. Otherwise, the results will not be realistic.
If you are satisfied with the results, you may consider automating your trades. However, it is strongly recommended to use a small amount of capital or a demo account to test proper execution before committing real funds.
🔸Create alerts to trigger the DCA Bot:
Verify Messages: Ensure the message matches the one specified by the DCA Bot.
Multi-Pair Configuration: For multi-pair setups, enable the option to add the symbol in the correct format.
Signal Settings: Enable whether you want to receive long or short signals (Entry | TP | SL), copy and paste the the messages for the DCA Bots configured.
Alert Setup:
When creating an alert, set the condition to the indicator and choose "alert() function call only.
Enter any desired Alert Name.
Open the Notifications tab, enable Webhook URL, and paste the Webhook URL.
For more details, refer to the section: "How to use TradingView Custom Signals".
Finalize Alerts: Click Create, you're done! Alerts will now be sent automatically in the correct format.
🔷 INDICATOR SETTINGS
MA 1: Fast MA Length
MA 2: Slow MA Length
MA Calc: MA's Calculations (SMA,EMA, RMA,WMA)
TP Ratio: This is the take profit ratio relative to the stop loss, where the trade will be closed in profit.
BE Ratio: This is the breakeven ratio relative to the stop loss, where the stop loss will be updated to breakeven or if the MA2 is greater than this level.
Strategy: Order Type direction in which trades are executed.
Use Custom Test Period: When enabled signals only works in the selected time window. If disabled it will use all historical data available on the chart.
Test Start and End: Once the Custom Test Period is enabled, here you select the start and end date that you want to analyze.
Check Messages: Enable the table to review the messages to be sent to the bot.
Entry | TP | SL: Enable this options to send Buy Entry, Take Profit (TP), and Stop Loss (SL) signals.
Deal Entry and Deal Exit : Copy and paste the message for the deal start signal and close order at Market Price of the DCA Bot. This is the message that will be sent with the alert to the Bot, you must verify that it is the same as the bot so that it can process properly so that it executes and starts the trade.
DCA Bot Multi-Pair: You must activate it if you want to use the signals in a DCA Bot Multi-pair in the text box you must enter (using the correct format) the symbol in which you are creating the alert, you can check the format of each symbol when you create the bot.
👨🏻💻💭 We hope this tool helps enhance your trading. Your feedback is invaluable, so feel free to share any suggestions for improvements or new features you'd like to see implemented.
__
The information and publications within the 3Commas TradingView account are not meant to be and do not constitute financial, investment, trading, or other types of advice or recommendations supplied or endorsed by 3Commas and any of the parties acting on behalf of 3Commas, including its employees, contractors, ambassadors, etc.

Buy The Dip - Does It Work?Buying the dip has become a meme in crypto, but does it actually work?
Using this script you can find out.
The dip is defined here as the average true range multiplied by a number of your choosing (dipness input) and subtracted from the low.
When price crosses under the dip level, a long is initiated. The long is then closed using a timestop (default value 20 bars), no fancy exits here.
A general rule for buying the dip should be to be more passive in a bull market and aggressive in a bear market.
Same goes for all counter trend trading.
Heres a few other examples of dip buying statistics using the H4 timeframe:
50% profitable, 1.692 Profit Factor
BINANCE:PIVXBTC
56.52% profitable, 1.254 Profit Factor
BINANCE:KMDBTC
27.27% Profitable, 0.257 Profit Factor... yikes!
BINANCE:BTSBTC
73.33% Profitable, 13.627 Profit Factor... o.O
BINANCE:MANABTC

Game Theory Trading StrategyGame Theory Trading Strategy: Explanation and Working Logic
This Pine Script (version 5) code implements a trading strategy named "Game Theory Trading Strategy" in TradingView. Unlike the previous indicator, this is a full-fledged strategy with automated entry/exit rules, risk management, and backtesting capabilities. It uses Game Theory principles to analyze market behavior, focusing on herd behavior, institutional flows, liquidity traps, and Nash equilibrium to generate buy (long) and sell (short) signals. Below, I'll explain the strategy's purpose, working logic, key components, and usage tips in detail.
1. General Description
Purpose: The strategy identifies high-probability trading opportunities by combining Game Theory concepts (herd behavior, contrarian signals, Nash equilibrium) with technical analysis (RSI, volume, momentum). It aims to exploit market inefficiencies caused by retail herd behavior, institutional flows, and liquidity traps. The strategy is designed for automated trading with defined risk management (stop-loss/take-profit) and position sizing based on market conditions.
Key Features:
Herd Behavior Detection: Identifies retail panic buying/selling using RSI and volume spikes.
Liquidity Traps: Detects stop-loss hunting zones where price breaks recent highs/lows but reverses.
Institutional Flow Analysis: Tracks high-volume institutional activity via Accumulation/Distribution and volume spikes.
Nash Equilibrium: Uses statistical price bands to assess whether the market is in equilibrium or deviated (overbought/oversold).
Risk Management: Configurable stop-loss (SL) and take-profit (TP) percentages, dynamic position sizing based on Game Theory (minimax principle).
Visualization: Displays Nash bands, signals, background colors, and two tables (Game Theory status and backtest results).
Backtesting: Tracks performance metrics like win rate, profit factor, max drawdown, and Sharpe ratio.
Strategy Settings:
Initial capital: $10,000.
Pyramiding: Up to 3 positions.
Position size: 10% of equity (default_qty_value=10).
Configurable inputs for RSI, volume, liquidity, institutional flow, Nash equilibrium, and risk management.
Warning: This is a strategy, not just an indicator. It executes trades automatically in TradingView's Strategy Tester. Always backtest thoroughly and use proper risk management before live trading.
2. Working Logic (Step by Step)
The strategy processes each bar (candle) to generate signals, manage positions, and update performance metrics. Here's how it works:
a. Input Parameters
The inputs are grouped for clarity:
Herd Behavior (🐑):
RSI Period (14): For overbought/oversold detection.
Volume MA Period (20): To calculate average volume for spike detection.
Herd Threshold (2.0): Volume multiplier for detecting herd activity.
Liquidity Analysis (💧):
Liquidity Lookback (50): Bars to check for recent highs/lows.
Liquidity Sensitivity (1.5): Volume multiplier for trap detection.
Institutional Flow (🏦):
Institutional Volume Multiplier (2.5): For detecting large volume spikes.
Institutional MA Period (21): For Accumulation/Distribution smoothing.
Nash Equilibrium (⚖️):
Nash Period (100): For calculating price mean and standard deviation.
Nash Deviation (0.02): Multiplier for equilibrium bands.
Risk Management (🛡️):
Use Stop-Loss (true): Enables SL at 2% below/above entry price.
Use Take-Profit (true): Enables TP at 5% above/below entry price.
b. Herd Behavior Detection
RSI (14): Checks for extreme conditions:
Overbought: RSI > 70 (potential herd buying).
Oversold: RSI < 30 (potential herd selling).
Volume Spike: Volume > SMA(20) x 2.0 (herd_threshold).
Momentum: Price change over 10 bars (close - close ) compared to its SMA(20).
Herd Signals:
Herd Buying: RSI > 70 + volume spike + positive momentum = Retail buying frenzy (red background).
Herd Selling: RSI < 30 + volume spike + negative momentum = Retail selling panic (green background).
c. Liquidity Trap Detection
Recent Highs/Lows: Calculated over 50 bars (liquidity_lookback).
Psychological Levels: Nearest round numbers (e.g., $100, $110) as potential stop-loss zones.
Trap Conditions:
Up Trap: Price breaks recent high, closes below it, with a volume spike (volume > SMA x 1.5).
Down Trap: Price breaks recent low, closes above it, with a volume spike.
Visualization: Traps are marked with small red/green crosses above/below bars.
d. Institutional Flow Analysis
Volume Check: Volume > SMA(20) x 2.5 (inst_volume_mult) = Institutional activity.
Accumulation/Distribution (AD):
Formula: ((close - low) - (high - close)) / (high - low) * volume, cumulated over time.
Smoothed with SMA(21) (inst_ma_length).
Accumulation: AD > MA + high volume = Institutions buying.
Distribution: AD < MA + high volume = Institutions selling.
Smart Money Index: (close - open) / (high - low) * volume, smoothed with SMA(20). Positive = Smart money buying.
e. Nash Equilibrium
Calculation:
Price mean: SMA(100) (nash_period).
Standard deviation: stdev(100).
Upper Nash: Mean + StdDev x 0.02 (nash_deviation).
Lower Nash: Mean - StdDev x 0.02.
Conditions:
Near Equilibrium: Price between upper and lower Nash bands (stable market).
Above Nash: Price > upper band (overbought, sell potential).
Below Nash: Price < lower band (oversold, buy potential).
Visualization: Orange line (mean), red/green lines (upper/lower bands).
f. Game Theory Signals
The strategy generates three types of signals, combined into long/short triggers:
Contrarian Signals:
Buy: Herd selling + (accumulation or down trap) = Go against retail panic.
Sell: Herd buying + (distribution or up trap).
Momentum Signals:
Buy: Below Nash + positive smart money + no herd buying.
Sell: Above Nash + negative smart money + no herd selling.
Nash Reversion Signals:
Buy: Below Nash + rising close (close > close ) + volume > MA.
Sell: Above Nash + falling close + volume > MA.
Final Signals:
Long Signal: Contrarian buy OR momentum buy OR Nash reversion buy.
Short Signal: Contrarian sell OR momentum sell OR Nash reversion sell.
g. Position Management
Position Sizing (Minimax Principle):
Default: 1.0 (10% of equity).
In Nash equilibrium: Reduced to 0.5 (conservative).
During institutional volume: Increased to 1.5 (aggressive).
Entries:
Long: If long_signal is true and no existing long position (strategy.position_size <= 0).
Short: If short_signal is true and no existing short position (strategy.position_size >= 0).
Exits:
Stop-Loss: If use_sl=true, set at 2% below/above entry price.
Take-Profit: If use_tp=true, set at 5% above/below entry price.
Pyramiding: Up to 3 concurrent positions allowed.
h. Visualization
Nash Bands: Orange (mean), red (upper), green (lower).
Background Colors:
Herd buying: Red (90% transparency).
Herd selling: Green.
Institutional volume: Blue.
Signals:
Contrarian buy/sell: Green/red triangles below/above bars.
Liquidity traps: Red/green crosses above/below bars.
Tables:
Game Theory Table (Top-Right):
Herd Behavior: Buying frenzy, selling panic, or normal.
Institutional Flow: Accumulation, distribution, or neutral.
Nash Equilibrium: In equilibrium, above, or below.
Liquidity Status: Trap detected or safe.
Position Suggestion: Long (green), Short (red), or Wait (gray).
Backtest Table (Bottom-Right):
Total Trades: Number of closed trades.
Win Rate: Percentage of winning trades.
Net Profit/Loss: In USD, colored green/red.
Profit Factor: Gross profit / gross loss.
Max Drawdown: Peak-to-trough equity drop (%).
Win/Loss Trades: Number of winning/losing trades.
Risk/Reward Ratio: Simplified Sharpe ratio (returns / drawdown).
Avg Win/Loss Ratio: Average win per trade / average loss per trade.
Last Update: Current time.
i. Backtesting Metrics
Tracks:
Total trades, winning/losing trades.
Win rate (%).
Net profit ($).
Profit factor (gross profit / gross loss).
Max drawdown (%).
Simplified Sharpe ratio (returns / drawdown).
Average win/loss ratio.
Updates metrics on each closed trade.
Displays a label on the last bar with backtest period, total trades, win rate, and net profit.
j. Alerts
No explicit alertconditions defined, but you can add them for long_signal and short_signal (e.g., alertcondition(long_signal, "GT Long Entry", "Long Signal Detected!")).
Use TradingView's alert system with Strategy Tester outputs.
3. Usage Tips
Timeframe: Best for H1-D1 timeframes. Shorter frames (M1-M15) may produce noisy signals.
Settings:
Risk Management: Adjust sl_percent (e.g., 1% for volatile markets) and tp_percent (e.g., 3% for scalping).
Herd Threshold: Increase to 2.5 for stricter herd detection in choppy markets.
Liquidity Lookback: Reduce to 20 for faster markets (e.g., crypto).
Nash Period: Increase to 200 for longer-term analysis.
Backtesting:
Use TradingView's Strategy Tester to evaluate performance.
Check win rate (>50%), profit factor (>1.5), and max drawdown (<20%) for viability.
Test on different assets/timeframes to ensure robustness.
Live Trading:
Start with a demo account.
Combine with other indicators (e.g., EMAs, support/resistance) for confirmation.
Monitor liquidity traps and institutional flow for context.
Risk Management:
Always use SL/TP to limit losses.
Adjust position_size for risk tolerance (e.g., 5% of equity for conservative trading).
Avoid over-leveraging (pyramiding=3 can amplify risk).
Troubleshooting:
If no trades are executed, check signal conditions (e.g., lower herd_threshold or liquidity_sensitivity).
Ensure sufficient historical data for Nash and liquidity calculations.
If tables overlap, adjust position.top_right/bottom_right coordinates.
4. Key Differences from the Previous Indicator
Indicator vs. Strategy: The previous code was an indicator (VP + Game Theory Integrated Strategy) focused on visualization and alerts. This is a strategy with automated entries/exits and backtesting.
Volume Profile: Absent in this strategy, making it lighter but less focused on high-volume zones.
Wick Analysis: Not included here, unlike the previous indicator's heavy reliance on wick patterns.
Backtesting: This strategy includes detailed performance metrics and a backtest table, absent in the indicator.
Simpler Signals: Focuses on Game Theory signals (contrarian, momentum, Nash reversion) without the "Power/Ultra Power" hierarchy.
Risk Management: Explicit SL/TP and dynamic position sizing, not present in the indicator.
5. Conclusion
The "Game Theory Trading Strategy" is a sophisticated system leveraging herd behavior, institutional flows, liquidity traps, and Nash equilibrium to trade market inefficiencies. It’s designed for traders who understand Game Theory principles and want automated execution with robust risk management. However, it requires thorough backtesting and parameter optimization for specific markets (e.g., forex, crypto, stocks). The backtest table and visual aids make it easy to monitor performance, but always combine with other analysis tools and proper capital management.
If you need help with backtesting, adding alerts, or optimizing parameters, let me know!

Candlestick Patterns detection and backtester [TrendX_]INTRODUCTION:
The Candlestick Patterns detection and backtester is designed to empower traders by identifying and analyzing candlestick patterns. Leveraging the robust Pine Script's add-in “All Candlestick Patterns”, this indicator meticulously scans the market for candlestick formations, offering insights into potential market movements. With its backtesting capabilities, we evaluate historical data to present traders with performance metrics such as win rates, net profit, and profit factors for each pattern. This allows traders to make informed decisions based on empirical evidence. The customizable settings, including trend filters and exit conditions, provide a tailored experience, adapting to various trading styles and strategies.
CREDIT:
This indicator is powered by the Pinescript add-in, *All Candlestick Patterns*, which provides a comprehensive library of candlestick formations.
TABLE USAGE:
The indicator features a detailed usage table that presents backtested results of all candlestick patterns. This includes:
Win Rates: The percentage of trades that resulted in a profit.
Net Profit: The total profit after subtracting losses from gains.
Profit Factor: A measure of the indicator’s profitability (gross profit / gross loss).
Total Trades: The total number of trades taken for every candlestick pattern's appearance.
CHART CANDLESTICK USAGE:
The indicator integrates candlestick pattern detections directly into the chart, displaying:
Pattern Detections: Each detected pattern is marked on the chart.
Win Rates: The win rate of each pattern is shown in brackets next to the detection.
CHART SETTINGS:
Users can customize the indicator with a variety of trend filters and settings:
Trend Filters: Apply filters based on SMA50, SMA200, Supertrend, and RSI threshold to refine pattern detections.
Exit Condition: Set an exit condition based on the crossing of a simple moving average of customizable length.
Visibility: Choose to show or hide the candlestick patterns’ detections on the chart.

Pinescript v4 - The Holy Grail (Trailing Stop)After studying several other scripts, I believe I have found the Holy Grail! (Or perhaps I've just found a bug with Tradingview's Pinescript v4 language) Anyhow, I'm publishing this script in the hope that someone smarter than myself could shed some light on the fact that adding a trailing stop to any strategy seems to make it miraculously...no that's an understatement...incredulously, stupendously, mind-bendingly profitable. I'm talking about INSANE profit factors, higher than 200x, with drawdowns of <10%. Sounds too good to be true? Maybe it is...or you could hook it up to your LIVE broker, and pray it doesn't explode. This is an upgraded version of my original Pin Bar Strategy.
Recommended Chart Settings:
Asset Class: Forex
Time Frame: H1
Long Entry Conditions:
a) Exponential Moving Average Fan up trend
b) Presence of a Bullish Pin Bar
c) Pin Bar pierces the Exponential Moving Average Fan
Short Entry Conditions:
a) Exponential Moving Average down trend
b) Presence of a Bearish Pin Bar
c) Pin Bar pierces the Exponential Moving Average Fan
Exit Conditions:
a) Trailing stop is hit
b) Moving Averages cross-back (optional)
c) It's the weekend
Default Robot Settings:
Equity Risk (%): 3 //how much account balance to risk per trade
Stop Loss (x*ATR, Float): 0.5 //stoploss = x * ATR, you can change x
Stop Loss Trail Points (Pips): 1 //the magic sauce, not sure how this works
Stop Loss Trail Offset (Pips): 1 //the magic sauce, not sure how this works
Slow SMA (Period): 50 //slow moving average period
Medium EMA (Period): 18 //medium exponential moving average period
Fast EMA (Period): 6 //fast exponential moving average period
ATR (Period): 14 // average true range period
Cancel Entry After X Bars (Period): 3 //cancel the order after x bars not triggered, you can change x
Backtest Results (2019 to 2020, H1, Default Settings):
AUDUSD - 1604% profit, 239.6 profit factor, 4.9% drawdown (INSANE)
NZDUSD - 1688.7% profit, 100.3 profit factor, 2.5% drawdown
GBPUSD - 1168.8% profit, 98.7 profit factor, 0% drawdown
USDJPY - 900.7% profit, 93.7 profit factor, 4.9% drawdown
USDCAD - 819% profit, 31.7 profit factor, 8.1% drawdown
EURUSD - 685.6% profit, 26.8 profit factor, 5.9% drawdown
USDCHF - 1008% profit, 18.7 profit factor, 8.6% drawdown
GBPJPY - 1173.4% profit, 16.1 profit factor, 7.9% drawdown
EURAUD - 613.3% profit, 14.4 profit factor, 9.8% drawdown
AUDJPY - 1619% profit, 11.26 profit factor, 9.1% drawdown
EURJPY - 897.2% profit, 6 profit factor, 13.8% drawdown
EURGBP - 608.9% profit, 5.3 profit factor, 9.8% drawdown (NOT TOO SHABBY)
As you can clearly see above, this forex robot is projected by the Tradingview backtester to be INSANELY profitable for all common forex pairs. So what was the difference between this strategy and my previous strategies? Check my code and look for "trail_points" and "trail_offset"; you can even look them up in the PineScript v4 documentation. They specify a trailing stop as the exit condition, which automatically closes the trade if price reverses against you.
I however suspect that the backtester is not properly calculating intra-bar price movement, and is using a simplified model. With this simplfied approach, the trailing stop code becomes some sort of "holy grail" generator, making every trade entered profitable.
Risk Warning:
This is a forex trading strategy that involves high risk of equity loss, and backtest performance will not equal future results. You agree to use this script at your own risk.
Hint:
To get more realistic results, and *maybe* overcome the intrabar simulation error, change the settings to: "Stop Loss Trail Points (pips)": 100
I am not sure if this eradicates the bug, but the entries and exits look more proper, and the profit factors are more believable.

FlowStateTrader FlowState Trader - Advanced Time-Filtered Strategy
## Overview
FlowState Trader is a sophisticated algorithmic trading strategy that combines precision entry signals with intelligent time-based filtering and adaptive risk management. Built for traders seeking to achieve their optimal performance state, FlowState identifies high-probability trading opportunities within user-defined time windows while employing dynamic trailing stops and partial position management.
## Core Strategy Philosophy
FlowState Trader operates on the principle that peak trading performance occurs when three elements align: **Focus** (precise entry signals), **Flow** (optimal time windows), and **State** (intelligent position management). This strategy excels at finding reversal opportunities at key support and resistance levels while filtering out suboptimal trading periods to keep traders in their optimal flow state.
## Key Features
### 🎯 Focus Entry System
**Support/Resistance Zone Trading**:
- Dynamic identification of key price levels using configurable lookback periods
- Entry signals triggered when price interacts with these critical zones
- Volume confirmation ensures genuine breakout/reversal momentum
- Trend filter alignment prevents counter-trend disasters
**Entry Conditions**:
- **Long Signals**: Price closes above support buffer, touches support level, with above-average volume
- **Short Signals**: Price closes below resistance buffer, touches resistance level, with above-average volume
- Optional trend filter using EMA or SMA for directional bias confirmation
### ⏰ FlowState Time Filtering System
**Comprehensive Time Controls**:
- **12-Hour Format Trading Windows**: User-friendly AM/PM time selection
- **Multi-Timezone Support**: UTC, EST, PST, CST with automatic conversion
- **Day-of-Week Filtering**: Trade only weekdays, weekends, or both
- **Lunch Hour Avoidance**: Automatically skips low-volume lunch periods (12-1 PM)
- **Visual Time Indicators**: Background coloring shows active/inactive trading periods
**Smart Time Features**:
- Handles overnight trading sessions seamlessly
- Prevents trades during historically poor performance periods
- Customizable trading hours for different market sessions
- Real-time trading window status in dashboard
### 🛡️ Adaptive Risk Management
**Multi-Level Take Profit System**:
- **TP1**: First profit target with optional partial position closure
- **TP2**: Final profit target for remaining position
- **Flexible Scaling**: Choose number of contracts to close at each level
**Dynamic Trailing Stop Technology**:
- **Three Operating Modes**:
- **Conservative**: Earlier activation, tighter trailing (protect profits)
- **Balanced**: Optimal risk/reward balance (recommended)
- **Aggressive**: Later activation, wider trailing (let winners run)
- **ATR-Based Calculations**: Adapts to current market volatility
- **Automatic Activation**: Engages when position reaches profitability threshold
### 📊 Intelligent Position Sizing
**Contract-Based Management**:
- Configurable entry quantity (1-1000 contracts)
- Partial close quantities for profit-taking
- Clear position tracking and P&L monitoring
- Real-time position status updates
### 🎨 Professional Visualization
**Enhanced Chart Elements**:
- **Entry Zone Highlighting**: Clear visual identification of trading opportunities
- **Dynamic Risk/Reward Lines**: Real-time TP and SL levels with price labels
- **Trailing Stop Visualization**: Live tracking of adaptive stop levels
- **Support/Resistance Lines**: Key level identification
- **Time Window Background**: Visual confirmation of active trading periods
**Dual Dashboard System**:
- **Strategy Dashboard**: Real-time position info, settings status, and current levels
- **Performance Scorecard**: Live P&L tracking, win rates, and trade statistics
- **Customizable Sizing**: Small, Medium, or Large display options
### ⚙️ Comprehensive Customization
**Core Strategy Settings**:
- **Lookback Period**: Support/resistance calculation period (5-100 bars)
- **ATR Configuration**: Period and multipliers for stops/targets
- **Reward-to-Risk Ratios**: Customizable profit target calculations
- **Trend Filter Options**: EMA/SMA selection with adjustable periods
**Time Filter Controls**:
- **Trading Hours**: Start/end times in 12-hour format
- **Timezone Selection**: Four major timezone options
- **Day Restrictions**: Weekend-only, weekday-only, or unrestricted
- **Session Management**: Lunch hour avoidance and custom periods
**Risk Management Options**:
- **Trailing Stop Modes**: Conservative/Balanced/Aggressive presets
- **Partial Close Settings**: Enable/disable with custom quantities
- **Alert System**: Comprehensive notifications for all trade events
### 📈 Performance Tracking
**Real-Time Metrics**:
- Net profit/loss calculation
- Win rate percentage
- Profit factor analysis
- Maximum drawdown tracking
- Total trade count and breakdown
- Current position P&L
**Trade Analytics**:
- Winner/loser ratio tracking
- Real-time performance scorecard
- Strategy effectiveness monitoring
- Risk-adjusted return metrics
### 🔔 Alert System
**Comprehensive Notifications**:
- Entry signal alerts with price and quantity
- Take profit level hits (TP1 and TP2)
- Stop loss activations
- Trailing stop engagements
- Position closure notifications
## Strategy Logic Deep Dive
### Entry Signal Generation
The strategy identifies high-probability reversal points by combining multiple confirmation factors:
1. **Price Action**: Looks for price interaction with key support/resistance levels
2. **Volume Confirmation**: Ensures sufficient market interest and liquidity
3. **Trend Alignment**: Optional filter prevents counter-trend positions
4. **Time Validation**: Only trades during user-defined optimal periods
5. **Zone Analysis**: Entry occurs within calculated buffer zones around key levels
### Risk Management Philosophy
FlowState Trader employs a three-tier risk management approach:
1. **Initial Protection**: ATR-based stop losses set at strategy entry
2. **Profit Preservation**: Trailing stops activate once position becomes profitable
3. **Scaled Exit**: Partial profit-taking allows for both security and potential
### Time-Based Edge
The time filtering system recognizes that not all trading hours are equal:
- Avoids low-volume, high-spread periods
- Focuses on optimal liquidity windows
- Prevents trading during news events (lunch hours)
- Allows customization for different market sessions
## Best Practices and Optimization
### Recommended Settings
**For Scalping (1-5 minute charts)**:
- Lookback Period: 10-20
- ATR Period: 14
- Trailing Stop: Conservative mode
- Time Filter: Major session hours only
**For Day Trading (15-60 minute charts)**:
- Lookback Period: 20-30
- ATR Period: 14-21
- Trailing Stop: Balanced mode
- Time Filter: Extended trading hours
**For Swing Trading (4H+ charts)**:
- Lookback Period: 30-50
- ATR Period: 21+
- Trailing Stop: Aggressive mode
- Time Filter: Disabled or very broad
### Market Compatibility
- **Forex**: Excellent for major pairs during active sessions
- **Stocks**: Ideal for liquid stocks during market hours
- **Futures**: Perfect for index and commodity futures
- **Crypto**: Effective on major cryptocurrencies (24/7 capability)
### Risk Considerations
- **Market Conditions**: Performance varies with volatility regimes
- **Timeframe Selection**: Lower timeframes require tighter risk management
- **Position Sizing**: Never risk more than 1-2% of account per trade
- **Backtesting**: Always test on historical data before live implementation
## Educational Value
FlowState serves as an excellent learning tool for:
- Understanding support/resistance trading
- Learning proper time-based filtering
- Mastering trailing stop techniques
- Developing systematic trading approaches
- Risk management best practices
## Disclaimer
This strategy is for educational and informational purposes only. Past performance does not guarantee future results. Trading involves substantial risk of loss and is not suitable for all investors. Users should thoroughly backtest the strategy and understand all risks before live trading. Always use proper position sizing and never risk more than you can afford to lose.
---
*FlowState Trader represents the evolution of systematic trading - combining classical technical analysis with modern risk management and intelligent time filtering to help traders achieve their optimal performance state through systematic, disciplined execution.*

RSI-Adaptive T3 + Squeeze Momentum Strategy✅ Strategy Guide: RSI-Adaptive T3 + Squeeze Momentum Strategy
📌 Overview
The RSI-Adaptive T3 + Squeeze Momentum Strategy is a dynamic trend-following strategy based on an RSI-responsive T3 moving average and Squeeze Momentum detection .
It adapts in real-time to market volatility to enhance entry precision and optimize risk.
⚠️ This strategy is provided for educational and research purposes only.
Past performance does not guarantee future results.
🎯 Strategy Objectives
The main objective of this strategy is to catch the early phase of a trend and generate consistent entry signals.
Designed to be intuitive and accessible for traders from beginner to advanced levels.
✨ Key Features
RSI-Responsive T3: T3 length dynamically adjusts according to RSI values for adaptive trend detection
Squeeze Momentum: Combines Bollinger Bands and Keltner Channels to identify trend buildup phases
Visual Triggers: Entry signals are generated from T3 crossovers and momentum strength after squeeze release
📊 Trading Rules
Long Entry:
When T3 crosses upward, momentum is positive, and the squeeze has just been released.
Short Entry:
When T3 crosses downward, momentum is negative, and the squeeze has just been released.
Exit (Reversal):
When the opposite condition to the entry is triggered, the position is reversed.
💰 Risk Management Parameters
Pair & Timeframe: BTC/USD (30-minute chart)
Capital (simulated): $30,00
Order size: `$100` per trade (realistic, low-risk sizing)
Commission: 0.02%
Slippage: 2 pips
Risk per Trade: 5%
Number of Trades (backtest period): 181
📊 Performance Overview
Symbol: BTC/USD
Timeframe: 30-minute chart
Date Range: January 1, 2024 – July 3, 2025
Win Rate: 47.8%
Profit Factor: 2.01
Net Profit: 173.16 (units not specified)
Max Drawdown: 5.77% or 24.91 (0.79%)
⚙️ Indicator Parameters
Indicator Name: RSI-Adaptive T3 + Squeeze Momentum
RSI Length: 14
T3 Min Length: 5
T3 Max Length: 50
T3 Volume Factor: 0.7
BB Length: 27 (Multiplier: 2.0)
KC Length: 20 (Multiplier: 1.5, TrueRange enabled)
🖼 Visual Support
T3 slope direction, squeeze status, and momentum bars are visually plotted on the chart,
providing high clarity for quick trend analysis and execution.
🔧 Strategy Improvements & Uniqueness
Inspired by the RSI Adaptive T3 by ChartPrime and Squeeze Momentum Indicator by LazyBear ,
this strategy fuses both into a hybrid trend-reversal and momentum breakout detection system .
Compared to traditional trend-following methods, it excels at capturing early trend signals with greater sensitivity .
✅ Summary
The RSI-Adaptive T3 + Squeeze Momentum Strategy combines momentum detection with volatility-responsive risk management.
With a strong balance between visual clarity and practicality, it serves as a powerful tool for traders seeking high repeatability.
⚠️ This strategy is based on historical data and does not guarantee future profits.
Always use appropriate risk management when applying it.
